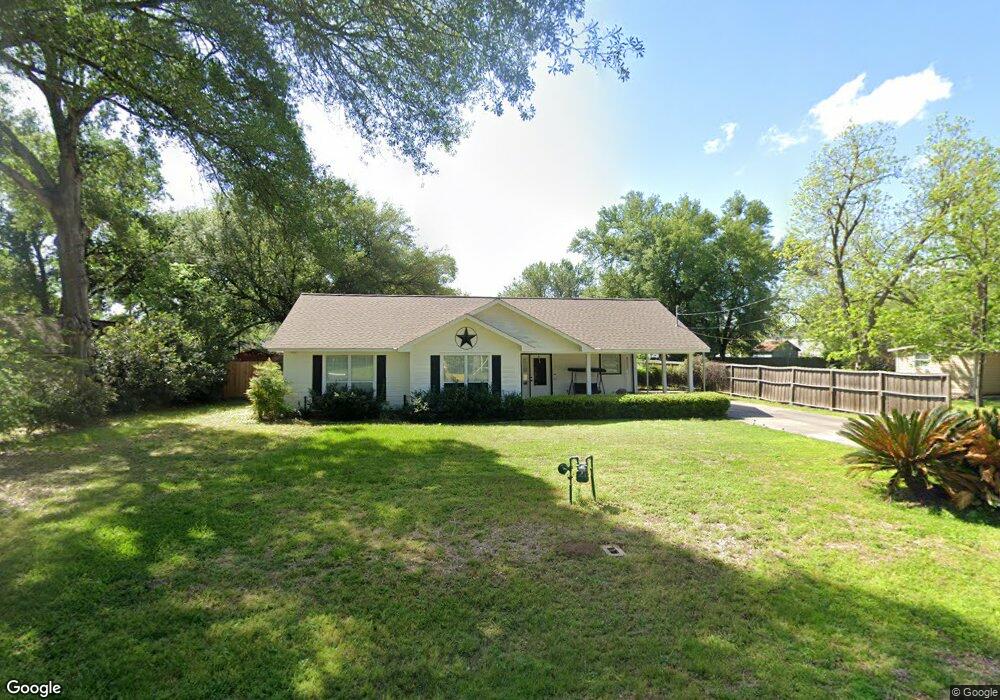
603 Kane St Tomball, TX 77375
Estimated Value: $325,528 - $370,000
2
Beds
2
Baths
1,458
Sq Ft
$241/Sq Ft
Est. Value
About This Home
This home is located at 603 Kane St, Tomball, TX 77375 and is currently estimated at $351,382, approximately $241 per square foot. 603 Kane St is a home located in Harris County with nearby schools including Tomball Elementary School, Tomball Intermediate School, and Tomball Junior High School.
Ownership History
Date
Name
Owned For
Owner Type
Purchase Details
Closed on
Sep 7, 2021
Sold by
Franklin W C W and Franklin Christine C
Bought by
Marsolek Samantha E and Franklin William S
Current Estimated Value
Home Financials for this Owner
Home Financials are based on the most recent Mortgage that was taken out on this home.
Original Mortgage
$194,000
Outstanding Balance
$176,526
Interest Rate
2.8%
Mortgage Type
New Conventional
Estimated Equity
$174,856
Purchase Details
Closed on
Jan 28, 2015
Sold by
Franklin Christine Caruso and Franklin Family Trust
Bought by
Caruso Franklin Sr William Carey and Caruso Franklin Christine
Purchase Details
Closed on
Feb 16, 2011
Sold by
Franklin W C and Franklin Christine C
Bought by
The Franklin Family Trust
Purchase Details
Closed on
Jun 30, 2003
Sold by
Thurman Linda Franklin
Bought by
Franklin W C and Franklin Christine C
Purchase Details
Closed on
May 14, 2002
Sold by
Conn Leland
Bought by
Thurman Linda Franklin
Create a Home Valuation Report for This Property
The Home Valuation Report is an in-depth analysis detailing your home's value as well as a comparison with similar homes in the area
Home Values in the Area
Average Home Value in this Area
Purchase History
| Date | Buyer | Sale Price | Title Company |
|---|---|---|---|
| Marsolek Samantha E | -- | Stewart Title | |
| Caruso Franklin Sr William Carey | -- | None Available | |
| The Franklin Family Trust | -- | None Available | |
| Franklin W C | -- | -- | |
| Thurman Linda Franklin | -- | Stewart Title |
Source: Public Records
Mortgage History
| Date | Status | Borrower | Loan Amount |
|---|---|---|---|
| Open | Marsolek Samantha E | $194,000 |
Source: Public Records
Tax History Compared to Growth
Tax History
| Year | Tax Paid | Tax Assessment Tax Assessment Total Assessment is a certain percentage of the fair market value that is determined by local assessors to be the total taxable value of land and additions on the property. | Land | Improvement |
|---|---|---|---|---|
| 2025 | $7,291 | $311,617 | $157,433 | $154,184 |
| 2024 | $7,291 | $329,410 | $146,937 | $182,473 |
| 2023 | $7,291 | $311,045 | $125,946 | $185,099 |
| 2022 | $5,732 | $254,312 | $94,460 | $159,852 |
| 2021 | $4,426 | $186,624 | $68,221 | $118,403 |
| 2020 | $4,165 | $169,805 | $52,478 | $117,327 |
| 2019 | $3,839 | $152,187 | $41,982 | $110,205 |
| 2018 | $2,880 | $214,918 | $41,982 | $172,936 |
| 2017 | $5,500 | $218,278 | $41,982 | $176,296 |
| 2016 | $5,156 | $204,594 | $41,982 | $162,612 |
| 2015 | $3,611 | $202,486 | $41,982 | $160,504 |
| 2014 | $3,611 | $141,869 | $41,982 | $99,887 |
Source: Public Records
Map
Nearby Homes
- 20734 Open Range Ct
- 18818 Cornelia Fields Ln
- 18723 Buttercup Farms Ln
- 20718 Open Range Ct
- 19951 Epona Creek Dr
- 19935 Epona Creek Dr
- 18707 Buttercup Farms Ln
- 20710 Open Range Ct
- 18826 Cornelia Fields Ln
- 20714 Open Range Ct
- 204 Vernon St
- 504 Percival St Unit A
- 200 S Vernon St
- 505 Percival St
- 516 Clayton St
- TBD Clayton St
- 0 N Sycamore St
- 16623 Farm To Market 2920
- 0 Fm-2920
- 1014 Graham Dr Unit A3
- 609 Kane St
- 211 N Magnolia St
- 604 Mason St
- 602 Mason St
- 606 Mason St Unit B
- 606 Mason St Unit A
- 604 Kane St
- 606 Kane St
- 600 Mason St
- 608 Kane St
- 212 N Magnolia St
- 608 Mason St
- 612 Kane St
- 301 N Poplar St
- 515 Kane St
- 303 N Poplar St
- 207 N Poplar St Unit A
- 207 N Poplar St Unit B
- 207 N Poplar St Unit C
- 207 N Poplar St Unit C