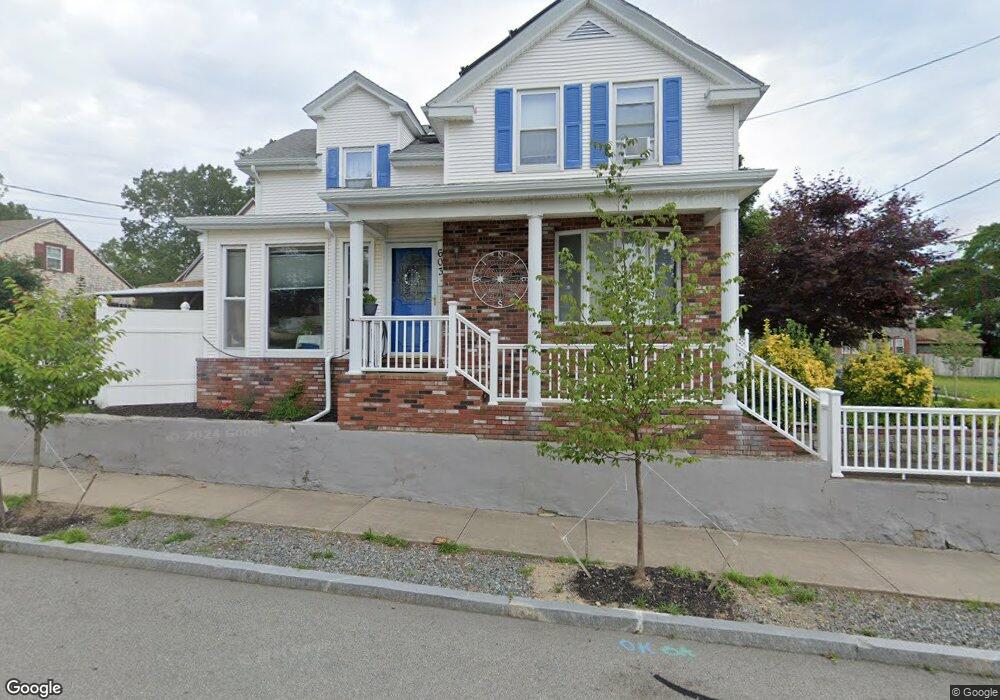
603 Maxfield St New Bedford, MA 02740
Downtown New Bedford NeighborhoodEstimated Value: $385,000 - $479,000
3
Beds
2
Baths
1,703
Sq Ft
$262/Sq Ft
Est. Value
About This Home
This home is located at 603 Maxfield St, New Bedford, MA 02740 and is currently estimated at $445,360, approximately $261 per square foot. 603 Maxfield St is a home located in Bristol County with nearby schools including Elizabeth Carter Brooks Elementary School, Keith Middle School, and New Bedford High School.
Ownership History
Date
Name
Owned For
Owner Type
Purchase Details
Closed on
Jan 31, 2025
Sold by
Gomes Christie D
Bought by
Xifaras Robin S
Current Estimated Value
Home Financials for this Owner
Home Financials are based on the most recent Mortgage that was taken out on this home.
Original Mortgage
$125,152
Outstanding Balance
$123,953
Interest Rate
5.75%
Mortgage Type
FHA
Estimated Equity
$321,407
Purchase Details
Closed on
Feb 16, 2022
Sold by
Xifaras Robin S
Bought by
Xifaras Robin S and Gomes Christie D
Create a Home Valuation Report for This Property
The Home Valuation Report is an in-depth analysis detailing your home's value as well as a comparison with similar homes in the area
Home Values in the Area
Average Home Value in this Area
Purchase History
| Date | Buyer | Sale Price | Title Company |
|---|---|---|---|
| Xifaras Robin S | -- | None Available | |
| Xifaras Robin S | -- | None Available | |
| Xifaras Robin S | -- | None Available | |
| Xifaras Robin S | -- | None Available | |
| Xifaras Robin S | -- | None Available |
Source: Public Records
Mortgage History
| Date | Status | Borrower | Loan Amount |
|---|---|---|---|
| Open | Xifaras Robin S | $125,152 | |
| Closed | Xifaras Robin S | $125,152 |
Source: Public Records
Tax History Compared to Growth
Tax History
| Year | Tax Paid | Tax Assessment Tax Assessment Total Assessment is a certain percentage of the fair market value that is determined by local assessors to be the total taxable value of land and additions on the property. | Land | Improvement |
|---|---|---|---|---|
| 2025 | $4,306 | $380,700 | $98,000 | $282,700 |
| 2024 | $3,724 | $310,300 | $91,000 | $219,300 |
| 2023 | $3,955 | $276,800 | $77,000 | $199,800 |
| 2022 | $3,498 | $225,100 | $70,000 | $155,100 |
| 2021 | $4,008 | $221,600 | $66,500 | $155,100 |
| 2020 | $3,301 | $204,300 | $66,500 | $137,800 |
| 2019 | $3,393 | $196,300 | $66,500 | $129,800 |
| 2018 | $334 | $171,500 | $66,500 | $105,000 |
| 2017 | $3,275 | $156,200 | $64,800 | $91,400 |
| 2016 | $2,492 | $151,100 | $63,000 | $88,100 |
| 2015 | $2,336 | $148,500 | $63,000 | $85,500 |
| 2014 | $2,357 | $155,500 | $61,300 | $94,200 |
Source: Public Records
Map
Nearby Homes
- 469 Hillman St
- ) Hapwell & Summit St
- 35 Jenny Lind St
- 124 Francis St
- 417 Maxfield St
- 26 Keene St
- 245 Brownell St
- 605 Union St
- 179 Tremont St
- 69 Newton St
- 122 Armour St
- 212 North St
- 82 Pierce St
- 135 Sycamore St
- 119 Tremont St
- 20 Shawmut Ave
- 317 Commonwealth Ave
- 295 Commonwealth Ave
- 41 Tilton St
- 57 Shawmut Ave