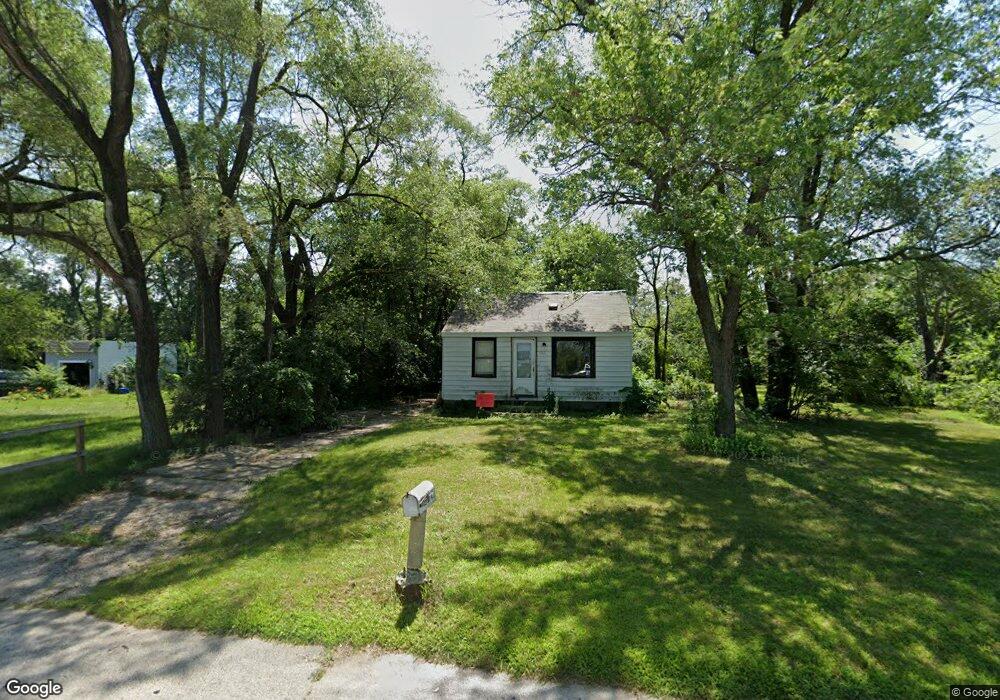
603 South Ave Rockford, IL 61109
Estimated Value: $64,043 - $109,000
2
Beds
1
Bath
814
Sq Ft
$107/Sq Ft
Est. Value
About This Home
This home is located at 603 South Ave, Rockford, IL 61109 and is currently estimated at $86,761, approximately $106 per square foot. 603 South Ave is a home located in Winnebago County with nearby schools including Riverdahl Elementary School, Rockford Environmental Science Academy, and Jefferson High School.
Ownership History
Date
Name
Owned For
Owner Type
Purchase Details
Closed on
Oct 2, 2024
Sold by
Carrasco Jazmin Diaz
Bought by
Sanchez Milagros
Current Estimated Value
Purchase Details
Closed on
Jan 12, 2024
Sold by
Nochebuena Alvaro and Stein Tiffany L
Bought by
Carrasco Jazmin Diaz
Purchase Details
Closed on
Oct 20, 2023
Sold by
Perez Carlos
Bought by
Ramirez Alvaro Nochebuena and Stein Tiffany L
Purchase Details
Closed on
Oct 18, 2023
Sold by
Perez Carlos
Bought by
Ramirez Alvaro Nochebuena and Stein Tiffany L
Purchase Details
Closed on
Jan 7, 2021
Sold by
Christian Solares
Bought by
Perez Carlos
Purchase Details
Closed on
Dec 9, 2020
Sold by
Winnebago County
Bought by
Solares Christian
Purchase Details
Closed on
Dec 3, 1996
Bought by
Thomas Jewel
Create a Home Valuation Report for This Property
The Home Valuation Report is an in-depth analysis detailing your home's value as well as a comparison with similar homes in the area
Home Values in the Area
Average Home Value in this Area
Purchase History
| Date | Buyer | Sale Price | Title Company |
|---|---|---|---|
| Sanchez Milagros | -- | None Listed On Document | |
| Carrasco Jazmin Diaz | -- | None Listed On Document | |
| Ramirez Alvaro Nochebuena | -- | None Listed On Document | |
| Ramirez Alvaro Nochebuena | -- | None Listed On Document | |
| Perez Carlos | $13,000 | None Listed On Document | |
| Solares Christian | -- | Denzin Soltanzadeh Llc | |
| Thomas Jewel | $22,000 | -- |
Source: Public Records
Tax History Compared to Growth
Tax History
| Year | Tax Paid | Tax Assessment Tax Assessment Total Assessment is a certain percentage of the fair market value that is determined by local assessors to be the total taxable value of land and additions on the property. | Land | Improvement |
|---|---|---|---|---|
| 2024 | $456 | $10,815 | $422 | $10,393 |
| 2023 | $639 | $12,157 | $374 | $11,783 |
| 2022 | $0 | $10,866 | $334 | $10,532 |
| 2021 | $486 | $9,963 | $306 | $9,657 |
| 2020 | $486 | $9,418 | $289 | $9,129 |
| 2019 | $506 | $8,976 | $275 | $8,701 |
| 2018 | $558 | $8,982 | $259 | $8,723 |
| 2017 | $560 | $8,596 | $248 | $8,348 |
| 2016 | $571 | $8,435 | $243 | $8,192 |
| 2015 | $578 | $8,435 | $243 | $8,192 |
| 2014 | $529 | $8,727 | $305 | $8,422 |
Source: Public Records
Map
Nearby Homes