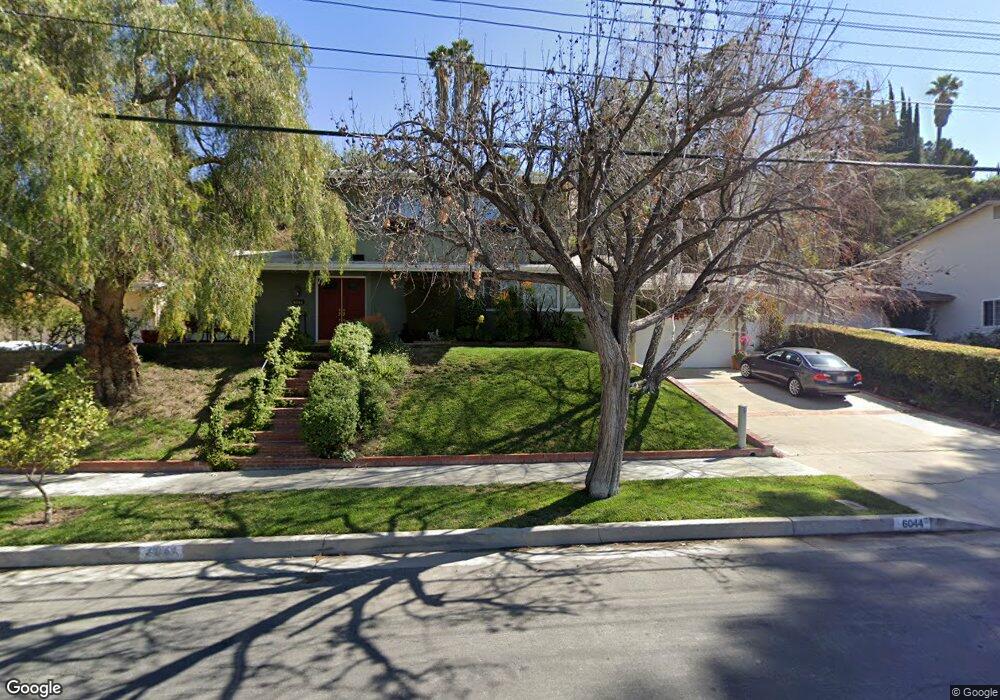
6044 Manton Ave Woodland Hills, CA 91367
Estimated Value: $1,387,479 - $1,549,000
4
Beds
2
Baths
2,226
Sq Ft
$649/Sq Ft
Est. Value
About This Home
This home is located at 6044 Manton Ave, Woodland Hills, CA 91367 and is currently estimated at $1,444,370, approximately $648 per square foot. 6044 Manton Ave is a home located in Los Angeles County with nearby schools including Lockhurst Drive Charter Elementary, Woodlake Elementary Community Charter, and Haynes Charter For Enriched Studies.
Ownership History
Date
Name
Owned For
Owner Type
Purchase Details
Closed on
Mar 29, 2017
Sold by
Heiss Scott R
Bought by
Heiss Scott and Heiss Nova
Current Estimated Value
Purchase Details
Closed on
Mar 17, 2006
Sold by
Klein Michael L and Klein Julie A
Bought by
Heiss Scott R
Home Financials for this Owner
Home Financials are based on the most recent Mortgage that was taken out on this home.
Original Mortgage
$628,000
Outstanding Balance
$356,595
Interest Rate
6.25%
Mortgage Type
Purchase Money Mortgage
Estimated Equity
$1,087,775
Purchase Details
Closed on
Dec 3, 2002
Sold by
Latner Jerome and Latner Lorine
Bought by
Klein Michael L
Home Financials for this Owner
Home Financials are based on the most recent Mortgage that was taken out on this home.
Original Mortgage
$322,700
Interest Rate
5%
Create a Home Valuation Report for This Property
The Home Valuation Report is an in-depth analysis detailing your home's value as well as a comparison with similar homes in the area
Home Values in the Area
Average Home Value in this Area
Purchase History
| Date | Buyer | Sale Price | Title Company |
|---|---|---|---|
| Heiss Scott | -- | None Available | |
| Heiss Scott R | $785,000 | Fidelity Van Nuys | |
| Klein Michael L | $415,000 | First American Title Co |
Source: Public Records
Mortgage History
| Date | Status | Borrower | Loan Amount |
|---|---|---|---|
| Open | Heiss Scott R | $628,000 | |
| Previous Owner | Klein Michael L | $322,700 | |
| Closed | Klein Michael L | $71,550 |
Source: Public Records
Tax History Compared to Growth
Tax History
| Year | Tax Paid | Tax Assessment Tax Assessment Total Assessment is a certain percentage of the fair market value that is determined by local assessors to be the total taxable value of land and additions on the property. | Land | Improvement |
|---|---|---|---|---|
| 2025 | $12,983 | $1,072,753 | $858,209 | $214,544 |
| 2024 | $12,983 | $1,051,720 | $841,382 | $210,338 |
| 2023 | $12,733 | $1,031,099 | $824,885 | $206,214 |
| 2022 | $12,143 | $1,010,882 | $808,711 | $202,171 |
| 2021 | $10,157 | $835,000 | $668,200 | $166,800 |
| 2019 | $9,276 | $761,000 | $609,000 | $152,000 |
| 2018 | $9,359 | $761,000 | $609,000 | $152,000 |
| 2016 | $8,790 | $719,000 | $575,200 | $143,800 |
| 2015 | $8,004 | $653,000 | $522,400 | $130,600 |
| 2014 | $7,422 | $590,000 | $472,000 | $118,000 |
Source: Public Records
Map
Nearby Homes
- 6001 Manton Ave
- 6172 Dalecrest Ave
- 6227 Glide Ave
- 23812 Calvert St
- 6236 Kenwater Ave
- 23416 Califa St
- 23432 Victory Blvd
- 23549 Victory Blvd Unit 21
- 23357 Hatteras St
- 5929 Adler Ave
- 23201 Oxnard St
- 6416 Kenwater Place
- 6153 Debs Ave
- 23717 Crosson Dr
- 23238 Victory Blvd
- 5622 Le Sage Ave
- 23853 Hatteras St
- 23123 Oxnard St
- 6022 Elba Place
- 23236 Hatteras St
- 6038 Manton Ave
- 6100 Manton Ave
- 23543 Aetna St
- 23539 Aetna St
- 23534 Aetna St
- 23536 Calvert St
- 6101 Manton Ave
- 6041 Manton Ave
- 23542 Calvert St
- 23530 Calvert St
- 6109 Manton Ave
- 6031 Manton Ave
- 23535 Aetna St
- 23528 Aetna St
- 23524 Calvert St
- 6117 Manton Ave
- 6023 Manton Ave
- 23525 Aetna St
- 6044 Le Sage Ave
- 6100 Le Sage Ave