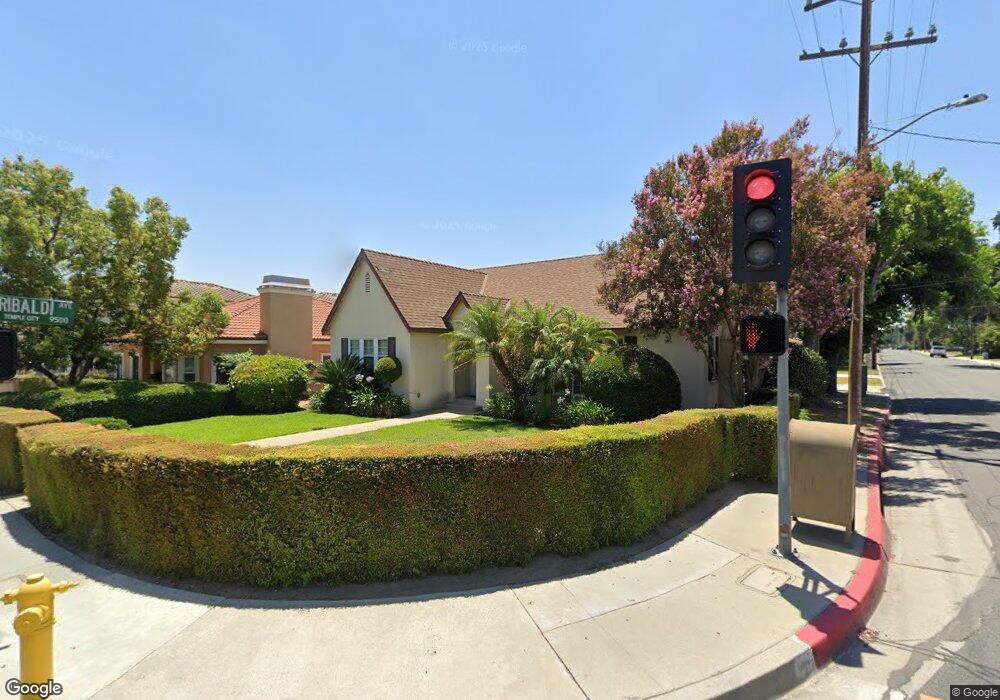
6057 Temple City Blvd Temple City, CA 91780
Estimated Value: $1,514,636 - $2,016,000
6
Beds
5
Baths
3,301
Sq Ft
$529/Sq Ft
Est. Value
About This Home
This home is located at 6057 Temple City Blvd, Temple City, CA 91780 and is currently estimated at $1,746,659, approximately $529 per square foot. 6057 Temple City Blvd is a home located in Los Angeles County with nearby schools including Longden Elementary School, Oak Avenue Intermediate School, and Temple City High School.
Ownership History
Date
Name
Owned For
Owner Type
Purchase Details
Closed on
Oct 29, 2010
Sold by
Law Steven and Law Irene
Bought by
Law Steven and Law Irene
Current Estimated Value
Home Financials for this Owner
Home Financials are based on the most recent Mortgage that was taken out on this home.
Original Mortgage
$603,000
Outstanding Balance
$397,851
Interest Rate
4.27%
Mortgage Type
New Conventional
Estimated Equity
$1,348,808
Purchase Details
Closed on
Feb 22, 2010
Sold by
Law Steven and Law Irene
Bought by
Law Steven and Law Irene
Home Financials for this Owner
Home Financials are based on the most recent Mortgage that was taken out on this home.
Original Mortgage
$605,000
Interest Rate
5.03%
Mortgage Type
New Conventional
Purchase Details
Closed on
Jan 28, 2010
Sold by
Law Steven and Law Irene
Bought by
Law Steven and Law Irene
Home Financials for this Owner
Home Financials are based on the most recent Mortgage that was taken out on this home.
Original Mortgage
$605,000
Interest Rate
5.03%
Mortgage Type
New Conventional
Purchase Details
Closed on
Jul 11, 2007
Sold by
Law Steven and Law Irene
Bought by
Law Steven and Law Irene
Home Financials for this Owner
Home Financials are based on the most recent Mortgage that was taken out on this home.
Original Mortgage
$605,000
Interest Rate
6.87%
Mortgage Type
New Conventional
Purchase Details
Closed on
Oct 25, 2006
Sold by
Law Steven W and Law Irene
Bought by
Law Steven and Law Irene
Purchase Details
Closed on
Apr 17, 2004
Sold by
Chia Hou S and Chia Rou W
Bought by
Law Steven W and Law Irene
Home Financials for this Owner
Home Financials are based on the most recent Mortgage that was taken out on this home.
Original Mortgage
$603,000
Interest Rate
5.92%
Mortgage Type
Purchase Money Mortgage
Purchase Details
Closed on
Sep 15, 2003
Sold by
Chia Harry Hou Sun
Bought by
Chia Hou S and Chia Rou W
Purchase Details
Closed on
Apr 26, 2003
Sold by
Sun Chia Harry Hou Sun and Sun Chia Hou
Bought by
Win Chia Hou Sun and Win Chia Rou
Home Financials for this Owner
Home Financials are based on the most recent Mortgage that was taken out on this home.
Original Mortgage
$60,000
Interest Rate
5.54%
Mortgage Type
Credit Line Revolving
Purchase Details
Closed on
Oct 28, 2002
Sold by
Win Chia Harry Hou Sun and Win Chia Rou
Bought by
Chia Harry Hou Sun
Home Financials for this Owner
Home Financials are based on the most recent Mortgage that was taken out on this home.
Original Mortgage
$303,000
Interest Rate
5.62%
Create a Home Valuation Report for This Property
The Home Valuation Report is an in-depth analysis detailing your home's value as well as a comparison with similar homes in the area
Home Values in the Area
Average Home Value in this Area
Purchase History
| Date | Buyer | Sale Price | Title Company |
|---|---|---|---|
| Law Steven | -- | Lsi | |
| Law Steven | -- | First American Title Company | |
| Law Steven | -- | First American Title Company | |
| Law Steven | -- | Accommodation | |
| Law Steven | -- | Ticor Title Co Glendale | |
| Law Steven | -- | None Available | |
| Law Steven W | $698,000 | Security Union Title | |
| Chia Hou S | -- | -- | |
| Win Chia Hou Sun | -- | Chicago | |
| Chia Harry Hou Sun | -- | Southland Title |
Source: Public Records
Mortgage History
| Date | Status | Borrower | Loan Amount |
|---|---|---|---|
| Open | Law Steven | $603,000 | |
| Closed | Law Steven | $605,000 | |
| Closed | Law Steven | $605,000 | |
| Previous Owner | Law Steven W | $603,000 | |
| Previous Owner | Win Chia Hou Sun | $60,000 | |
| Previous Owner | Chia Harry Hou Sun | $303,000 |
Source: Public Records
Tax History Compared to Growth
Tax History
| Year | Tax Paid | Tax Assessment Tax Assessment Total Assessment is a certain percentage of the fair market value that is determined by local assessors to be the total taxable value of land and additions on the property. | Land | Improvement |
|---|---|---|---|---|
| 2025 | $13,604 | $1,133,327 | $710,890 | $422,437 |
| 2024 | $13,604 | $1,111,105 | $696,951 | $414,154 |
| 2023 | $13,300 | $1,089,320 | $683,286 | $406,034 |
| 2022 | $12,456 | $1,067,962 | $669,889 | $398,073 |
| 2021 | $12,674 | $1,047,022 | $656,754 | $390,268 |
| 2020 | $12,499 | $1,036,287 | $650,020 | $386,267 |
| 2019 | $12,224 | $1,015,969 | $637,275 | $378,694 |
| 2018 | $11,924 | $996,049 | $624,780 | $371,269 |
| 2016 | $11,420 | $957,373 | $600,520 | $356,853 |
| 2015 | $11,228 | $942,993 | $591,500 | $351,493 |
| 2014 | $11,069 | $924,522 | $579,914 | $344,608 |
Source: Public Records
Map
Nearby Homes
- 6119 Temple City Blvd
- 9711 Garibaldi Ave
- 6204 Oak Ave
- 6037 Oak Ave
- 9665 Longden Ave
- 5929 Oak Ave
- 6022 Rowland Ave
- 5819 Baldwin Ave Unit C
- 6227 Sultana Ave
- 639 W Longden Ave
- 9861 E Lemon Ave
- 9138 Emperor Ave
- 6433 Livia Ave
- 9618 E Camino Real Ave
- 0 Sultana Ave
- 6137 Rosemead Blvd
- 6159 Rosemead Blvd
- 5530 Alessandro Ave
- 5823 Myda Ave
- 5635 Noel Dr
- 6053 Temple City Blvd Unit A
- 6053 Temple City Blvd
- 6049 Temple City Blvd Unit B
- 6051 Temple City Blvd Unit B
- 6049 Temple City Blvd Unit C
- 6051 Temple City Blvd Unit C
- 6051 Temple City Blvd Unit A
- 6049 Temple City Blvd Unit A
- 9557 Garibaldi Ave
- 9567 Garibaldi Ave
- 6105 Temple City Blvd
- 9563 Garibaldi Ave
- 6055 Temple City Blvd
- 6052 Primrose Ave
- 6056 Primrose Ave Unit D
- 6058 Primrose Ave Unit C
- 6060 Primrose Ave Unit B
- 6062 Primrose Ave
- 6043 Temple City Blvd
- 6033 Temple City Blvd