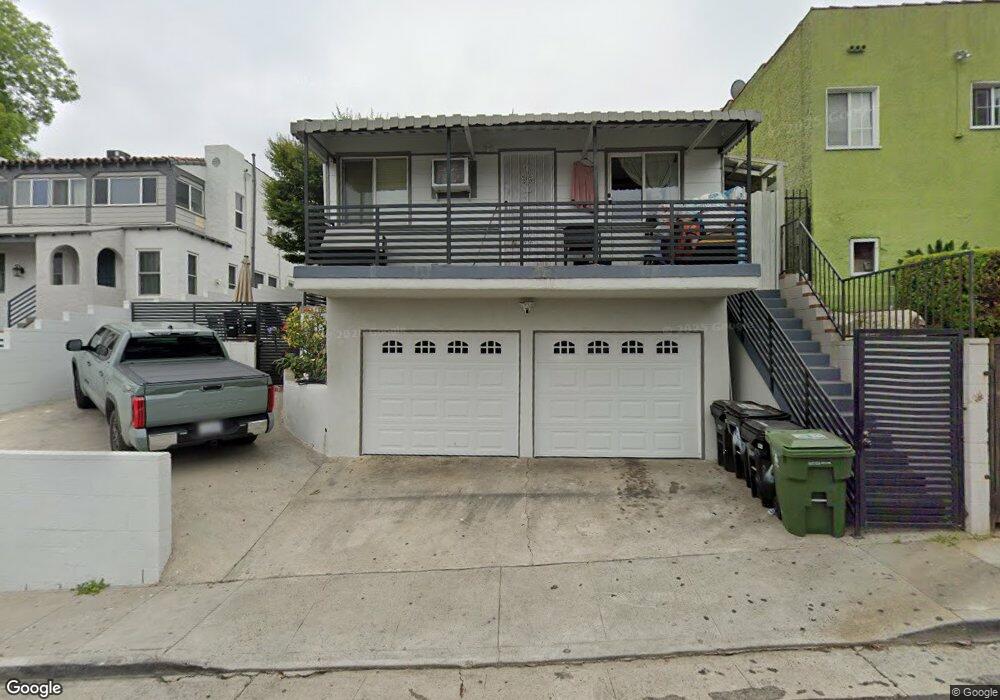
606 N Vendome St Los Angeles, CA 90026
Estimated Value: $1,288,727 - $1,631,000
3
Beds
3
Baths
2,098
Sq Ft
$675/Sq Ft
Est. Value
About This Home
This home is located at 606 N Vendome St, Los Angeles, CA 90026 and is currently estimated at $1,415,432, approximately $674 per square foot. 606 N Vendome St is a home located in Los Angeles County with nearby schools including Micheltorena Street Elementary School, Virgil Middle School, and Belmont High School.
Ownership History
Date
Name
Owned For
Owner Type
Purchase Details
Closed on
Feb 4, 2020
Sold by
Castillo Luis and Castillo Martha
Bought by
Castillo Maurillo
Current Estimated Value
Purchase Details
Closed on
Sep 23, 1998
Sold by
Nunez Fernando and Nunez Delmy
Bought by
Castillo Luis
Home Financials for this Owner
Home Financials are based on the most recent Mortgage that was taken out on this home.
Original Mortgage
$192,038
Outstanding Balance
$40,951
Interest Rate
6.88%
Mortgage Type
FHA
Estimated Equity
$1,374,481
Purchase Details
Closed on
Apr 12, 1995
Sold by
Matsushige Vivian Joan
Bought by
Nunez Fernando
Home Financials for this Owner
Home Financials are based on the most recent Mortgage that was taken out on this home.
Original Mortgage
$136,800
Interest Rate
8.44%
Create a Home Valuation Report for This Property
The Home Valuation Report is an in-depth analysis detailing your home's value as well as a comparison with similar homes in the area
Home Values in the Area
Average Home Value in this Area
Purchase History
| Date | Buyer | Sale Price | Title Company |
|---|---|---|---|
| Castillo Maurillo | -- | Western Resources Ttl & Synr | |
| Castillo Luis | $198,000 | First American Title Co | |
| Nunez Fernando | $152,000 | Equity Title |
Source: Public Records
Mortgage History
| Date | Status | Borrower | Loan Amount |
|---|---|---|---|
| Open | Castillo Luis | $192,038 | |
| Previous Owner | Nunez Fernando | $136,800 |
Source: Public Records
Tax History Compared to Growth
Tax History
| Year | Tax Paid | Tax Assessment Tax Assessment Total Assessment is a certain percentage of the fair market value that is determined by local assessors to be the total taxable value of land and additions on the property. | Land | Improvement |
|---|---|---|---|---|
| 2025 | $4,054 | $310,382 | $249,255 | $61,127 |
| 2024 | $4,054 | $304,297 | $244,368 | $59,929 |
| 2023 | $3,981 | $298,331 | $239,577 | $58,754 |
| 2022 | $3,805 | $292,482 | $234,880 | $57,602 |
| 2021 | $3,751 | $286,748 | $230,275 | $56,473 |
| 2019 | $3,644 | $278,245 | $223,446 | $54,799 |
| 2018 | $3,538 | $272,790 | $219,065 | $53,725 |
| 2016 | $3,366 | $262,199 | $210,559 | $51,640 |
| 2015 | $3,319 | $258,262 | $207,397 | $50,865 |
| 2014 | $3,343 | $253,204 | $203,335 | $49,869 |
Source: Public Records
Map
Nearby Homes
- 2971 London St
- 2958 London St
- 660 Silver Lake Blvd
- 353 N Reno St
- 700 N Dillon St
- 636 Robinson St
- 727 N La Fayette Park Place
- 317 Occidental Blvd
- 408 N La Fayette Park Place
- 3221 Robinson Ln
- 802 N Dillon St
- 617 Micheltorena St
- 3415 Bellevue Ave
- 608 N Rampart Blvd
- 242 N Dillon St
- 406 N Rampart Blvd
- 851 N Rampart Blvd
- 230 N Reno St
- 3439 Plata St
- 860 N Occidental Blvd
- 612 N Vendome St
- 3001 Bellevue Ave
- 616 N Vendome St
- 607 Parkman Ave Unit 2
- 607 Parkman Ave Unit 3
- 607 Parkman Ave Unit 4
- 607 Parkman Ave
- 622 N Vendome St
- 611 Parkman Ave
- 2939 Bellevue Ave
- 601 N Vendome St
- 617 Parkman Ave
- 611 N Vendome St
- 607 N Vendome St
- 626 N Vendome St
- 623 Parkman Ave
- 2978 Bellevue Ave
- 3006 Bellevue Ave
- 623 N Vendome St
- 3051 Bellevue Ave