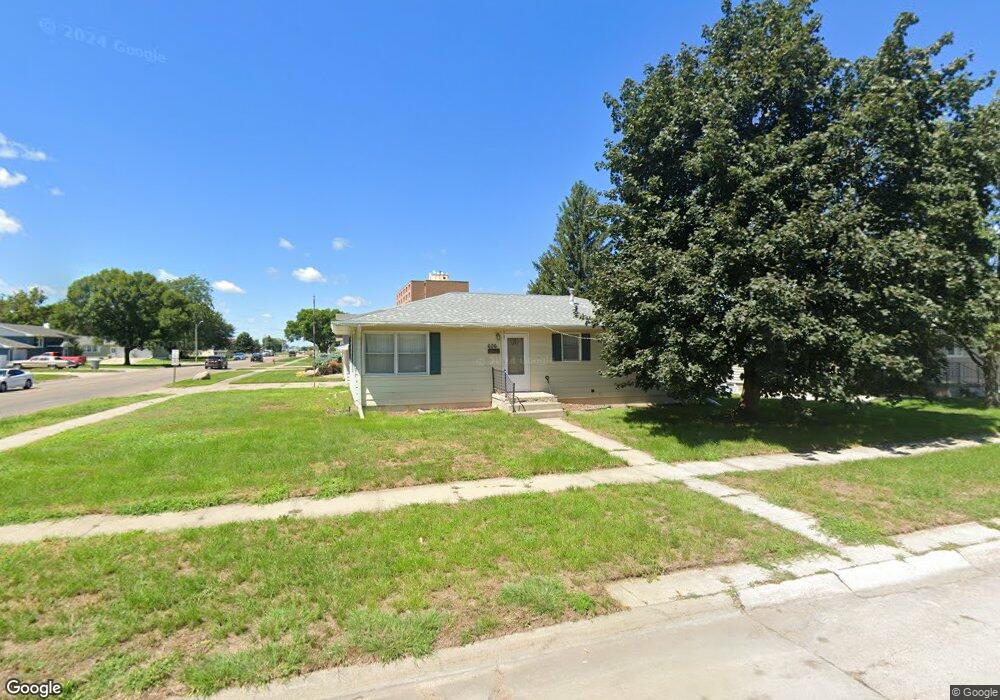
606 S 15th St Norfolk, NE 68701
Estimated Value: $232,295 - $265,000
3
Beds
2
Baths
1,144
Sq Ft
$214/Sq Ft
Est. Value
About This Home
This home is located at 606 S 15th St, Norfolk, NE 68701 and is currently estimated at $244,824, approximately $214 per square foot. 606 S 15th St is a home located in Madison County with nearby schools including Norfolk Senior High School, Sacred Heart Elementary School, and Norfolk Catholic School.
Ownership History
Date
Name
Owned For
Owner Type
Purchase Details
Closed on
Dec 23, 2019
Sold by
Fisher Samuel J and Fisher Mikayla M
Bought by
Gronenthal Bailey P and Bermel William A
Current Estimated Value
Home Financials for this Owner
Home Financials are based on the most recent Mortgage that was taken out on this home.
Original Mortgage
$121,212
Outstanding Balance
$106,635
Interest Rate
3.6%
Mortgage Type
New Conventional
Estimated Equity
$138,189
Purchase Details
Closed on
Jul 1, 2014
Sold by
Rios Marcus V and Rios Sheila B
Bought by
Fisher Samuel J and Gronethal Mikayla M
Home Financials for this Owner
Home Financials are based on the most recent Mortgage that was taken out on this home.
Original Mortgage
$92,787
Interest Rate
4.25%
Mortgage Type
FHA
Purchase Details
Closed on
Jun 14, 2006
Sold by
Svehla Jay K and Svehla Michelle M
Bought by
Rios Marcus V and Rios Sheila B
Create a Home Valuation Report for This Property
The Home Valuation Report is an in-depth analysis detailing your home's value as well as a comparison with similar homes in the area
Home Values in the Area
Average Home Value in this Area
Purchase History
| Date | Buyer | Sale Price | Title Company |
|---|---|---|---|
| Gronenthal Bailey P | $119,000 | Stewart Title Company | |
| Fisher Samuel J | $95,000 | American Title & Escrow Co | |
| Rios Marcus V | $94,000 | -- |
Source: Public Records
Mortgage History
| Date | Status | Borrower | Loan Amount |
|---|---|---|---|
| Open | Gronenthal Bailey P | $121,212 | |
| Previous Owner | Fisher Samuel J | $92,787 |
Source: Public Records
Tax History Compared to Growth
Tax History
| Year | Tax Paid | Tax Assessment Tax Assessment Total Assessment is a certain percentage of the fair market value that is determined by local assessors to be the total taxable value of land and additions on the property. | Land | Improvement |
|---|---|---|---|---|
| 2024 | $2,417 | $194,796 | $16,363 | $178,433 |
| 2023 | $3,329 | $180,063 | $16,363 | $163,700 |
| 2022 | $3,013 | $162,524 | $16,363 | $146,161 |
| 2021 | $2,784 | $150,456 | $16,363 | $134,093 |
| 2020 | $2,571 | $139,384 | $16,363 | $123,021 |
| 2019 | $2,468 | $129,226 | $16,363 | $112,863 |
| 2018 | $2,440 | $129,878 | $22,440 | $107,438 |
| 2017 | $2,300 | $122,283 | $22,440 | $99,843 |
| 2016 | $1,842 | $97,732 | $8,865 | $88,867 |
| 2015 | $1,842 | $97,732 | $8,865 | $88,867 |
| 2014 | $1,815 | $93,500 | $8,865 | $84,635 |
| 2013 | $1,763 | $87,963 | $8,865 | $79,098 |
Source: Public Records
Map
Nearby Homes
- 2300 Taylor Ave
- 2308 Taylor Ave
- 809 S 14th St
- 103 S 13th Place
- See Legal
- 1312 Hayes Ave
- 1809 W Taylor Ave
- 1313 W Park Ave
- 706 Columbia St
- 207 S 17th St
- 3307 W Michigan Ave
- 3206 W Michigan Ave
- 3205 W Michigan Ave
- 3306 W Michigan Ave
- 404 S 12th St
- 2005 Sunset Ave
- 1208 W Phillip Ave
- 105 19th Dr
- 2102 Sunset Ave
- 602 S 10th St
- 1504 W Pasewalk Ave
- 1501 W Pasewalk Ave
- 605 S 15th St
- 602 S 15th St
- 1506 W Pasewalk Ave
- 1503 W Pasewalk Ave
- 1505 W Pasewalk Ave
- 1503 Taylor Ave
- 1507 W Pasewalk Ave
- 600 S 15th St
- 1505 Taylor Ave
- 1600 W Pasewalk Ave
- 601 S 15th St
- 700 S 16th St
- 1403 Taylor Ave
- 606 S 14th St
- 1410 W Bluff Ave
- 604 S 14th St
- 602 S 14th St
- 510 S 15th St