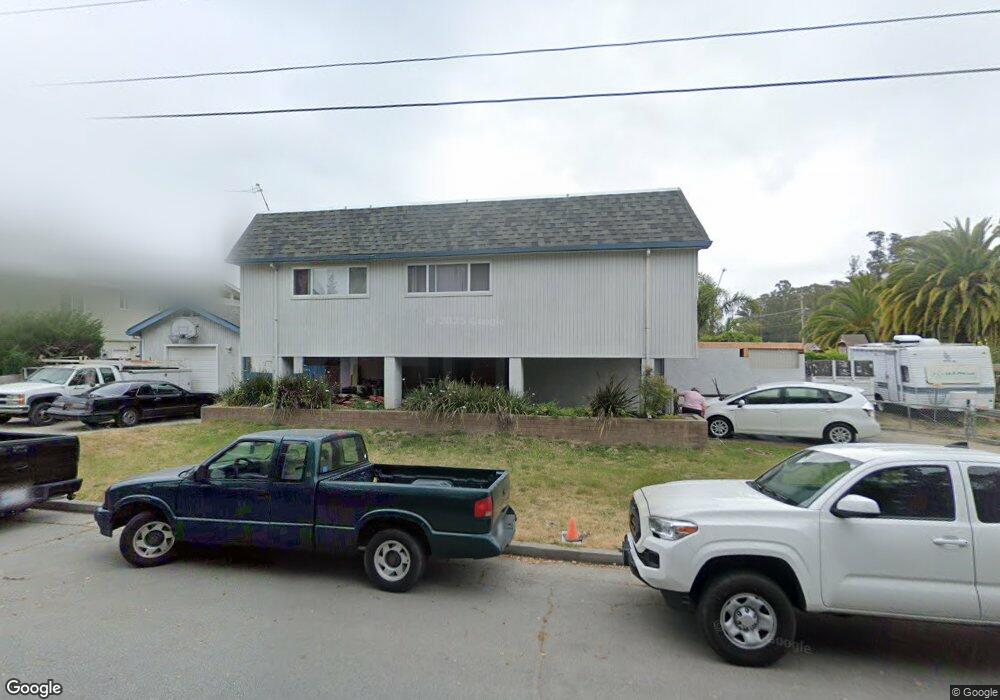
606 Trevethan Ave Santa Cruz, CA 95065
Prospect Heights NeighborhoodEstimated Value: $1,467,000 - $1,804,000
3
Beds
3
Baths
2,243
Sq Ft
$738/Sq Ft
Est. Value
About This Home
This home is located at 606 Trevethan Ave, Santa Cruz, CA 95065 and is currently estimated at $1,656,424, approximately $738 per square foot. 606 Trevethan Ave is a home located in Santa Cruz County with nearby schools including De Laveaga Elementary School, Mission Hill Middle School, and Harbor High School.
Ownership History
Date
Name
Owned For
Owner Type
Purchase Details
Closed on
Mar 9, 2021
Sold by
Visel Janice and Oppelt Stephen F
Bought by
Visel Janice and Oppelt Stephen F
Current Estimated Value
Home Financials for this Owner
Home Financials are based on the most recent Mortgage that was taken out on this home.
Original Mortgage
$423,500
Interest Rate
2.7%
Mortgage Type
New Conventional
Purchase Details
Closed on
Sep 14, 2006
Sold by
Visel Janice
Bought by
Visel Janice and Oppelt Stephen F
Home Financials for this Owner
Home Financials are based on the most recent Mortgage that was taken out on this home.
Original Mortgage
$502,000
Interest Rate
6.51%
Mortgage Type
New Conventional
Purchase Details
Closed on
Feb 28, 2005
Sold by
Visel Janice
Bought by
Visel Janice
Home Financials for this Owner
Home Financials are based on the most recent Mortgage that was taken out on this home.
Original Mortgage
$419,000
Interest Rate
1%
Mortgage Type
New Conventional
Purchase Details
Closed on
Mar 6, 2001
Sold by
Visel Peter D
Bought by
Visel Janice
Create a Home Valuation Report for This Property
The Home Valuation Report is an in-depth analysis detailing your home's value as well as a comparison with similar homes in the area
Home Values in the Area
Average Home Value in this Area
Purchase History
| Date | Buyer | Sale Price | Title Company |
|---|---|---|---|
| Visel Janice | -- | Mortgage Connect | |
| Visel Janice | -- | Accommodation | |
| Visel Janice | -- | First American Title Ins Co | |
| Visel Janice | -- | -- |
Source: Public Records
Mortgage History
| Date | Status | Borrower | Loan Amount |
|---|---|---|---|
| Closed | Visel Janice | $423,500 | |
| Closed | Visel Janice | $502,000 | |
| Closed | Visel Janice | $419,000 |
Source: Public Records
Tax History Compared to Growth
Tax History
| Year | Tax Paid | Tax Assessment Tax Assessment Total Assessment is a certain percentage of the fair market value that is determined by local assessors to be the total taxable value of land and additions on the property. | Land | Improvement |
|---|---|---|---|---|
| 2025 | $5,941 | $523,220 | $292,279 | $230,941 |
| 2023 | $5,869 | $502,903 | $280,930 | $221,973 |
| 2022 | $5,804 | $493,042 | $275,421 | $217,621 |
| 2021 | $4,952 | $416,862 | $224,246 | $192,616 |
| 2020 | $4,914 | $412,586 | $221,946 | $190,640 |
| 2019 | $4,801 | $404,496 | $217,594 | $186,902 |
| 2018 | $4,747 | $396,566 | $213,328 | $183,238 |
| 2017 | $4,687 | $388,786 | $209,142 | $179,644 |
| 2016 | $4,438 | $381,164 | $205,042 | $176,122 |
| 2015 | $4,278 | $375,438 | $201,962 | $173,476 |
| 2014 | $4,207 | $368,084 | $198,006 | $170,078 |
Source: Public Records
Map
Nearby Homes
- 631 Park Way
- 511 Pacheco Ave
- 151 Molly Way
- 111 Elk St
- 916 Melrose Ave
- 305 Morrissey Blvd
- 180 Delaveaga Park Dr
- 2308 7th Ave
- 719 Darwin St
- 2606 Paul Minnie Ave
- 104 Meadowview Ln
- 1024 Webster St
- 203 Vista Prieta Ct
- 103 Vista Prieta Ct
- 210 Vista Prieta Ct
- 209 Fieldcrest Ln
- 1733 Eastbrook Ct
- 161 Harbor Oaks Cir
- 1220 Webster St
- 118 Stoney Creek Rd
- 905 Morrissey Blvd
- 614 Trevethan Ave
- 913 Morrissey Blvd
- 825 Morrissey Blvd
- 616 Trevethan Ave
- 613 Park Way
- 817 Morrissey Blvd
- 601 Park Way
- 617 Trevethan Ave
- 617 Park Way
- 620 Trevethan Ave
- 621 Trevethan Ave
- 621 Park Way
- 807 Morrissey Blvd
- 626 Trevethan Ave
- 625 Trevethan Ave
- 625 Park Way
- 614 Marnell Ave
- 629 Trevethan Ave
- 618 Marnell Ave