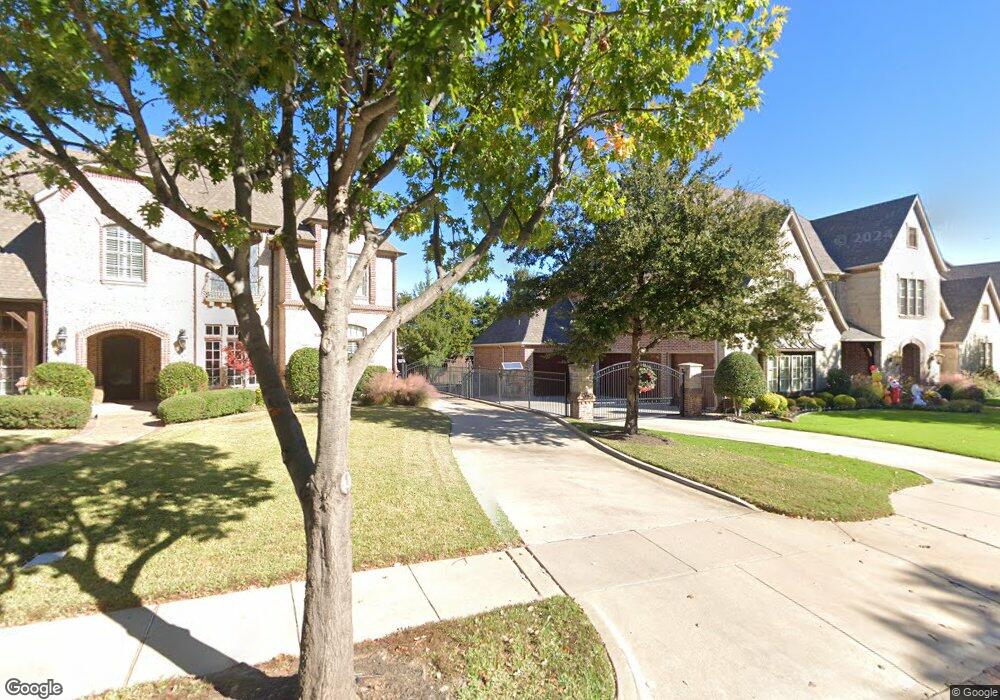
607 E Dove Rd Southlake, TX 76092
Estimated Value: $1,390,000 - $1,971,919
3
Beds
2
Baths
1,680
Sq Ft
$988/Sq Ft
Est. Value
About This Home
This home is located at 607 E Dove Rd, Southlake, TX 76092 and is currently estimated at $1,659,480, approximately $987 per square foot. 607 E Dove Rd is a home located in Tarrant County with nearby schools including Jack D. Johnson Elementary, Don T. Durham Intermediate School, and Carroll Middle School.
Ownership History
Date
Name
Owned For
Owner Type
Purchase Details
Closed on
Sep 27, 2021
Sold by
Blain Brian
Bought by
Blain Brian and Blain Bethany
Current Estimated Value
Purchase Details
Closed on
Nov 24, 2020
Sold by
Ferris Christopher A
Bought by
Blain Brian
Home Financials for this Owner
Home Financials are based on the most recent Mortgage that was taken out on this home.
Original Mortgage
$386,400
Outstanding Balance
$343,056
Interest Rate
2.8%
Mortgage Type
New Conventional
Estimated Equity
$1,316,424
Purchase Details
Closed on
Jun 17, 2009
Sold by
Ferris Tamara Jane
Bought by
Ferris Christopher Allen
Purchase Details
Closed on
Aug 4, 2006
Sold by
Vann William Lonnie and Vann Lonnie W
Bought by
Ferris Christopher A
Home Financials for this Owner
Home Financials are based on the most recent Mortgage that was taken out on this home.
Original Mortgage
$200,000
Interest Rate
6.87%
Mortgage Type
Purchase Money Mortgage
Create a Home Valuation Report for This Property
The Home Valuation Report is an in-depth analysis detailing your home's value as well as a comparison with similar homes in the area
Home Values in the Area
Average Home Value in this Area
Purchase History
| Date | Buyer | Sale Price | Title Company |
|---|---|---|---|
| Blain Brian | -- | Juniper Title Inc | |
| Blain Brian | -- | Juniper Title Inc | |
| Ferris Christopher Allen | -- | None Available | |
| Ferris Christopher A | -- | None Available |
Source: Public Records
Mortgage History
| Date | Status | Borrower | Loan Amount |
|---|---|---|---|
| Open | Blain Brian | $386,400 | |
| Previous Owner | Ferris Christopher A | $200,000 |
Source: Public Records
Tax History Compared to Growth
Tax History
| Year | Tax Paid | Tax Assessment Tax Assessment Total Assessment is a certain percentage of the fair market value that is determined by local assessors to be the total taxable value of land and additions on the property. | Land | Improvement |
|---|---|---|---|---|
| 2025 | $20,666 | $1,500,000 | $835,500 | $664,500 |
| 2024 | $20,666 | $1,340,938 | $584,850 | $756,088 |
| 2023 | $9,705 | $700,000 | $584,850 | $115,150 |
| 2022 | $10,787 | $500,000 | $443,625 | $56,375 |
| 2021 | $11,012 | $483,000 | $482,000 | $1,000 |
| 2020 | $9,167 | $725,518 | $657,000 | $68,518 |
| 2019 | $8,779 | $725,348 | $657,000 | $68,348 |
| 2018 | $7,341 | $329,581 | $264,632 | $64,949 |
| 2017 | $7,426 | $549,273 | $457,000 | $92,273 |
| 2016 | $6,751 | $555,347 | $457,500 | $97,847 |
| 2015 | $5,874 | $247,619 | $152,625 | $94,994 |
| 2014 | $5,874 | $247,619 | $152,625 | $94,994 |
Source: Public Records
Map
Nearby Homes
- 424 Saint Tropez Dr
- 2112 Beaver Creek Ln
- 212 Saint Tropez Dr
- 208 Saint Tropez Dr
- 1013 Winfield Ct
- 1828 Riviera Ln
- 1820 Riviera Ln
- 1018 Quail Run Rd
- 1812 Riviera Ln
- 5 W Dove Rd
- 1821 Cannes Cir
- 1836 Riviera Ln
- 1829 Cannes Cir
- 100 La Rambla Ct
- 116 La Rambla Ct
- 217 La Rambla Ct
- 209 La Rambla Ct
- 1816 Riviera Ln
- 124 La Rambla Ct
- 225 Murano Place
- 650 Castle Rock Dr
- 646 Castle Rock Dr
- 642 Castle Rock Dr
- 2200 Estes Park Rd
- 591 E Dove Rd
- 700 Castle Rock Dr
- 638 Castle Rock Dr
- 704 Castle Rock Dr
- 708 Castle Rock Dr
- 2162 Estes Park Rd
- 587 E Dove Rd
- 2158 Estes Park Rd
- 701 Castle Rock Dr
- 634 Castle Rock Dr
- 535 E Dove Rd
- 2154 Estes Park Rd
- 712 Castle Rock Dr
- 705 Castle Rock Dr
- 2105 Denver Dr
- 575 E Dove Rd