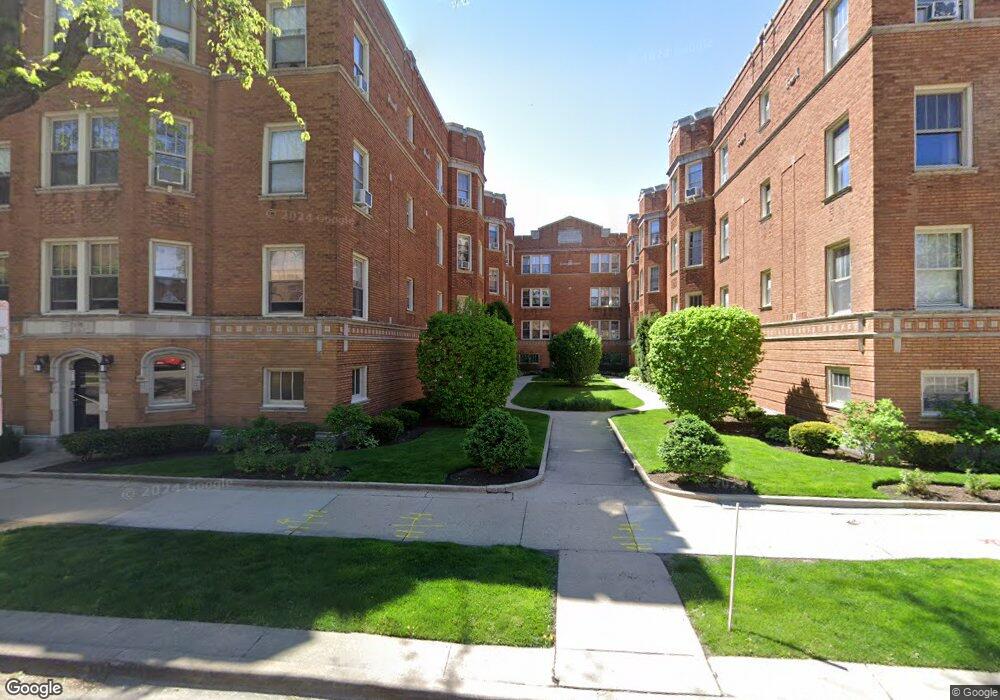
607 Washington Blvd Unit 6072 Oak Park, IL 60302
Estimated Value: $162,508 - $183,000
--
Bed
--
Bath
47,973
Sq Ft
$4/Sq Ft
Est. Value
About This Home
This home is located at 607 Washington Blvd Unit 6072, Oak Park, IL 60302 and is currently estimated at $171,877, approximately $3 per square foot. 607 Washington Blvd Unit 6072 is a home located in Cook County with nearby schools including Longfellow Elementary School, Percy Julian Middle School, and Oak Park and River Forest High School.
Ownership History
Date
Name
Owned For
Owner Type
Purchase Details
Closed on
Mar 8, 2022
Sold by
Posmer Lauren and Posmer Neil
Bought by
Parker Daniel
Current Estimated Value
Purchase Details
Closed on
Feb 28, 2022
Sold by
Posmer Lauren and Posmer Neil
Bought by
Parker Daniel
Purchase Details
Closed on
Dec 14, 2012
Sold by
Posmer Lauren E and Johnson Lauren
Bought by
Posmer Lauren E
Home Financials for this Owner
Home Financials are based on the most recent Mortgage that was taken out on this home.
Original Mortgage
$133,825
Interest Rate
4%
Mortgage Type
New Conventional
Purchase Details
Closed on
May 26, 2004
Sold by
Fox Partners Lp
Bought by
Johnson Lauren
Home Financials for this Owner
Home Financials are based on the most recent Mortgage that was taken out on this home.
Original Mortgage
$147,181
Interest Rate
4.75%
Mortgage Type
Unknown
Create a Home Valuation Report for This Property
The Home Valuation Report is an in-depth analysis detailing your home's value as well as a comparison with similar homes in the area
Home Values in the Area
Average Home Value in this Area
Purchase History
| Date | Buyer | Sale Price | Title Company |
|---|---|---|---|
| Parker Daniel | $125,000 | -- | |
| Parker Daniel | $125,000 | -- | |
| Posmer Lauren E | -- | None Available | |
| Johnson Lauren | $162,000 | Prairie Title |
Source: Public Records
Mortgage History
| Date | Status | Borrower | Loan Amount |
|---|---|---|---|
| Previous Owner | Posmer Lauren E | $133,825 | |
| Previous Owner | Johnson Lauren | $147,181 |
Source: Public Records
Tax History Compared to Growth
Tax History
| Year | Tax Paid | Tax Assessment Tax Assessment Total Assessment is a certain percentage of the fair market value that is determined by local assessors to be the total taxable value of land and additions on the property. | Land | Improvement |
|---|---|---|---|---|
| 2024 | $4,235 | $12,991 | $683 | $12,308 |
| 2023 | $3,564 | $12,991 | $683 | $12,308 |
| 2022 | $3,564 | $9,282 | $720 | $8,562 |
| 2021 | $3,473 | $9,281 | $720 | $8,561 |
| 2020 | $2,255 | $9,281 | $720 | $8,561 |
| 2019 | $1,963 | $8,547 | $659 | $7,888 |
| 2018 | $1,888 | $8,547 | $659 | $7,888 |
| 2017 | $1,868 | $8,547 | $659 | $7,888 |
| 2016 | $2,380 | $8,410 | $549 | $7,861 |
| 2015 | $2,087 | $8,410 | $549 | $7,861 |
| 2014 | $1,958 | $8,410 | $549 | $7,861 |
| 2013 | $2,106 | $9,102 | $549 | $8,553 |
Source: Public Records
Map
Nearby Homes
- 415 Wesley Ave Unit 21
- 415 Wesley Ave Unit 36
- 510 Madison St Unit 1N
- 510 Madison St Unit 3S
- 512 Madison St Unit 1S
- 508 Madison St Unit 2S
- 315 S Scoville Ave
- 514 Wesley Ave
- 444 Washington Blvd Unit 404
- 444 Washington Blvd Unit 207
- 603 Wesley Ave
- 331 S Ridgeland Ave Unit B
- 820 Washington Blvd Unit G
- 224 S Oak Park Ave Unit 1B
- 229 S Ridgeland Ave
- 839 Madison St Unit 207
- 839 Madison St Unit 307
- 839 Madison St Unit 301
- 839 Madison St Unit 202
- 839 Madison St Unit 502
- 607 Washington Blvd Unit 3N
- 601 Washington Blvd Unit 2
- 601 Washington Blvd Unit 6013
- 607 Washington Blvd Unit 607G
- 607 Washington Blvd Unit 6073
- 607 Washington Blvd Unit 6073
- 601 Washington Blvd Unit 6011
- 607 Washington Blvd Unit 6071
- 601 Washington Blvd Unit 6012
- 607 Washington Blvd Unit 6072
- 607 Washington Blvd Unit 6071
- 607 Washington Blvd Unit 1S
- 607 Washington Blvd Unit G
- 607 Washington Blvd Unit 2N
- 601 Washington Blvd Unit 3
- 601 Washington Blvd Unit 1
- 607 Washington Blvd Unit 2S
- 605 Washington Blvd Unit 6052
- 605 Washington Blvd Unit 6052
- 605 Washington Blvd Unit 6051