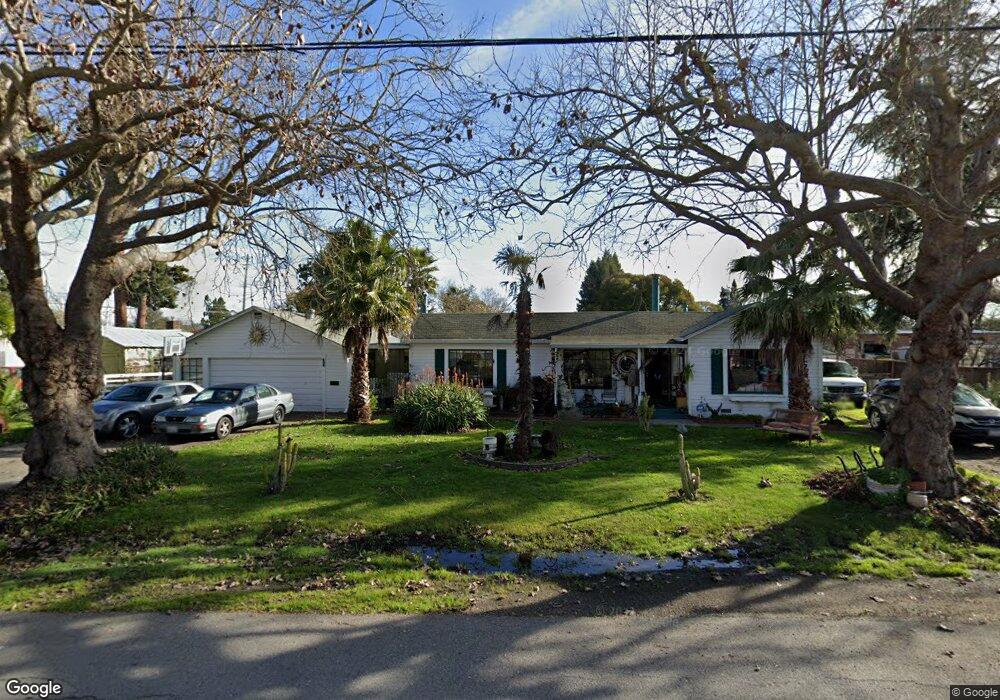
608 Clover Dr Santa Rosa, CA 95401
Estimated Value: $563,000 - $646,000
3
Beds
1
Bath
1,204
Sq Ft
$492/Sq Ft
Est. Value
About This Home
This home is located at 608 Clover Dr, Santa Rosa, CA 95401 and is currently estimated at $592,763, approximately $492 per square foot. 608 Clover Dr is a home located in Sonoma County with nearby schools including Abraham Lincoln Elementary School, Santa Rosa Middle School, and Santa Rosa High School.
Ownership History
Date
Name
Owned For
Owner Type
Purchase Details
Closed on
Jan 5, 2021
Sold by
Young Beverly M
Bought by
Young Beverly Marie and Beverly Marie Young Living Tru
Current Estimated Value
Home Financials for this Owner
Home Financials are based on the most recent Mortgage that was taken out on this home.
Original Mortgage
$221,000
Outstanding Balance
$197,243
Interest Rate
2.71%
Mortgage Type
New Conventional
Estimated Equity
$395,520
Purchase Details
Closed on
Aug 16, 2019
Sold by
Young Beverly M
Bought by
Young Beverly Marie and Beverly Marie Young Living Tru
Purchase Details
Closed on
May 6, 2005
Sold by
Brandlin Donald L and The Barbara A Brandlin Living
Bought by
Young Beverly M
Home Financials for this Owner
Home Financials are based on the most recent Mortgage that was taken out on this home.
Original Mortgage
$280,000
Interest Rate
6.02%
Mortgage Type
Purchase Money Mortgage
Purchase Details
Closed on
Nov 9, 1998
Sold by
Brandlin Barbara T and Brandlin Barbara A
Bought by
Brandlin Barbara A and Barbara A Brandlin Living Trus
Create a Home Valuation Report for This Property
The Home Valuation Report is an in-depth analysis detailing your home's value as well as a comparison with similar homes in the area
Home Values in the Area
Average Home Value in this Area
Purchase History
| Date | Buyer | Sale Price | Title Company |
|---|---|---|---|
| Young Beverly Marie | -- | Fidelity National Title Co | |
| Young Beverly M | -- | Fidelity National Title Co | |
| Young Beverly Marie | -- | None Available | |
| Young Beverly M | $532,500 | Chicago Title Co | |
| Brandlin Barbara A | -- | -- |
Source: Public Records
Mortgage History
| Date | Status | Borrower | Loan Amount |
|---|---|---|---|
| Open | Young Beverly M | $221,000 | |
| Closed | Young Beverly M | $280,000 |
Source: Public Records
Tax History Compared to Growth
Tax History
| Year | Tax Paid | Tax Assessment Tax Assessment Total Assessment is a certain percentage of the fair market value that is determined by local assessors to be the total taxable value of land and additions on the property. | Land | Improvement |
|---|---|---|---|---|
| 2025 | $721 | $61,855 | $18,202 | $43,653 |
| 2024 | $721 | $60,644 | $17,846 | $42,798 |
| 2023 | $721 | $59,456 | $17,497 | $41,959 |
| 2022 | $668 | $58,291 | $17,154 | $41,137 |
| 2021 | $656 | $57,149 | $16,818 | $40,331 |
| 2020 | $655 | $56,564 | $16,646 | $39,918 |
| 2019 | $651 | $55,456 | $16,320 | $39,136 |
| 2018 | $648 | $54,369 | $16,000 | $38,369 |
| 2017 | $637 | $53,304 | $15,687 | $37,617 |
| 2016 | $622 | $52,260 | $15,380 | $36,880 |
| 2015 | $604 | $51,476 | $15,149 | $36,327 |
| 2014 | $567 | $50,469 | $14,853 | $35,616 |
Source: Public Records
Map
Nearby Homes
- 919 Kingwood St
- 788 Simpson Place
- 706 Simpson Place
- 1239 Eardley Ave
- 595 N Dutton Ave
- 709 W 8th St
- 713 Blair Place
- 493 Umland Dr
- 730 Hewett St
- 223 Decker St
- 1027 Borden Villa Dr
- 303 Hewett St
- 415 Duncan St
- 1154 Adrienne Way
- 139 Sandalwood Ct
- 205 Westbrook Dr
- 1166 Healey Ct
- 100 W 8th St
- 1080 Tijuana Ct
- 743 Davis St