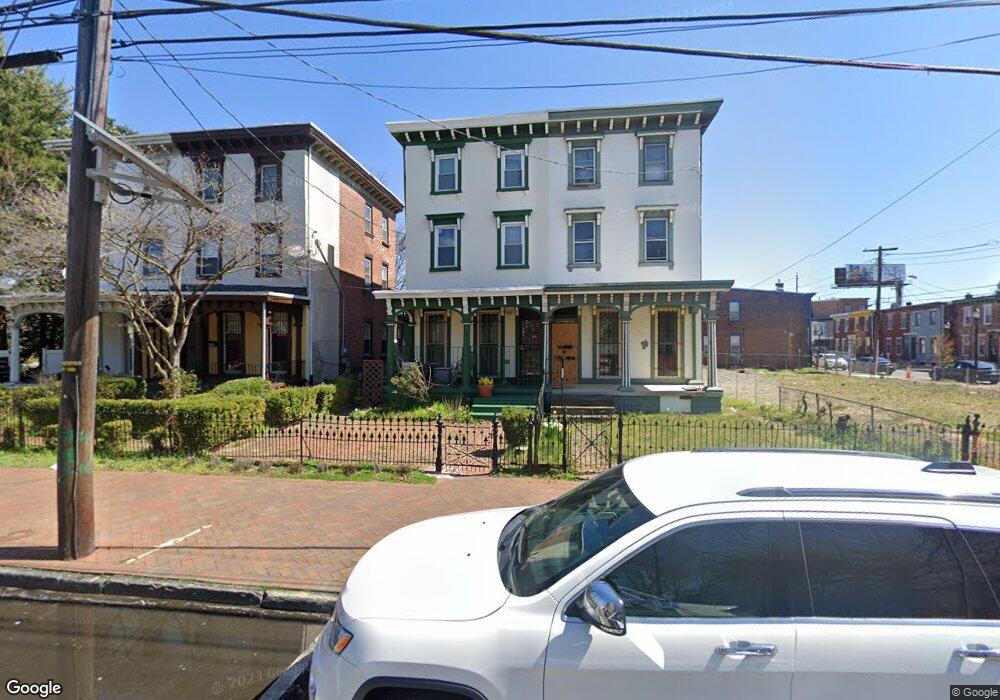
608 N 2nd St Camden, NJ 08102
North Camden NeighborhoodEstimated Value: $284,000 - $398,000
5
Beds
3
Baths
2,780
Sq Ft
$122/Sq Ft
Est. Value
About This Home
This home is located at 608 N 2nd St, Camden, NJ 08102 and is currently estimated at $338,909, approximately $121 per square foot. 608 N 2nd St is a home located in Camden County with nearby schools including Cooper's Poynt Elementary School, Eastside High School, and Leap Academy University Charter School.
Ownership History
Date
Name
Owned For
Owner Type
Purchase Details
Closed on
Aug 12, 2009
Sold by
Richard Tyrone and Richards April
Bought by
French Ingrid L
Current Estimated Value
Home Financials for this Owner
Home Financials are based on the most recent Mortgage that was taken out on this home.
Original Mortgage
$100,000
Outstanding Balance
$65,432
Interest Rate
5.36%
Mortgage Type
Purchase Money Mortgage
Estimated Equity
$273,477
Purchase Details
Closed on
Dec 9, 2003
Sold by
Liberty Real Holdings
Bought by
Richards Tyrone and Richards April
Home Financials for this Owner
Home Financials are based on the most recent Mortgage that was taken out on this home.
Original Mortgage
$68,400
Interest Rate
5.98%
Purchase Details
Closed on
Jul 17, 2003
Sold by
Kleinberg Ronald
Bought by
Liberty Real Holdings
Create a Home Valuation Report for This Property
The Home Valuation Report is an in-depth analysis detailing your home's value as well as a comparison with similar homes in the area
Home Values in the Area
Average Home Value in this Area
Purchase History
| Date | Buyer | Sale Price | Title Company |
|---|---|---|---|
| French Ingrid L | $125,000 | -- | |
| Richards Tyrone | $72,000 | -- | |
| Liberty Real Holdings | $22,500 | -- |
Source: Public Records
Mortgage History
| Date | Status | Borrower | Loan Amount |
|---|---|---|---|
| Open | French Ingrid L | $100,000 | |
| Previous Owner | Richards Tyrone | $68,400 |
Source: Public Records
Tax History Compared to Growth
Tax History
| Year | Tax Paid | Tax Assessment Tax Assessment Total Assessment is a certain percentage of the fair market value that is determined by local assessors to be the total taxable value of land and additions on the property. | Land | Improvement |
|---|---|---|---|---|
| 2025 | $4,751 | $134,100 | $13,500 | $120,600 |
| 2024 | $4,593 | $134,100 | $13,500 | $120,600 |
| 2023 | $4,593 | $134,100 | $13,500 | $120,600 |
| 2022 | $4,507 | $134,100 | $13,500 | $120,600 |
| 2021 | $4,491 | $134,100 | $13,500 | $120,600 |
| 2020 | $4,264 | $134,100 | $13,500 | $120,600 |
| 2019 | $4,083 | $134,100 | $13,500 | $120,600 |
| 2018 | $4,062 | $134,100 | $13,500 | $120,600 |
| 2017 | $3,963 | $134,100 | $13,500 | $120,600 |
| 2016 | $3,837 | $134,100 | $13,500 | $120,600 |
| 2015 | $3,693 | $134,100 | $13,500 | $120,600 |
| 2014 | $3,605 | $134,100 | $13,500 | $120,600 |
Source: Public Records
Map
Nearby Homes