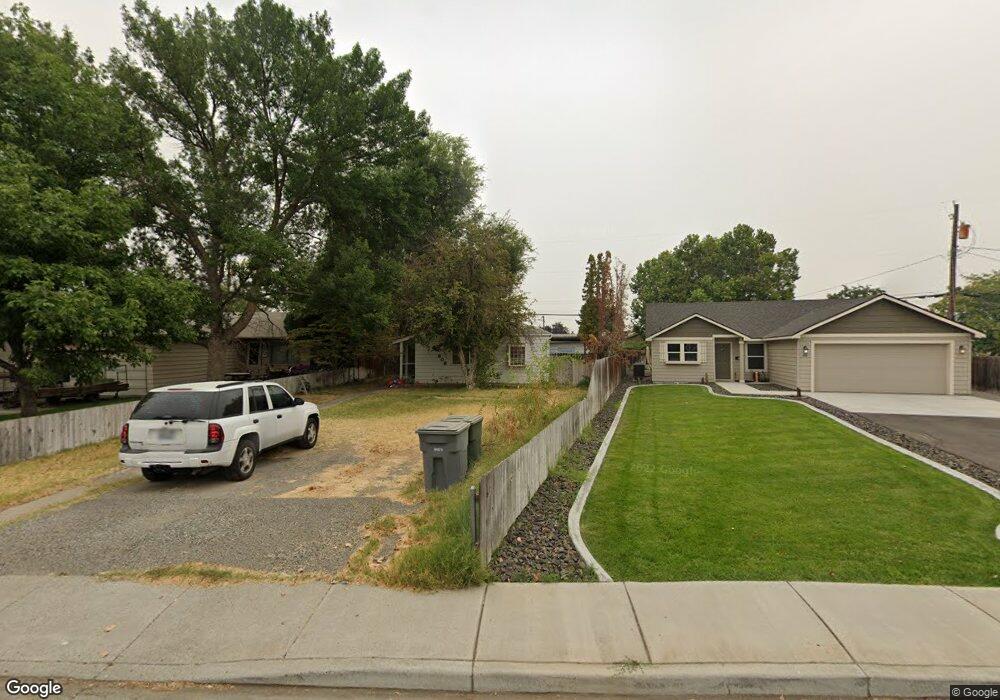
608 Sanford Ave Richland, WA 99352
Estimated Value: $313,000 - $339,000
3
Beds
2
Baths
1,284
Sq Ft
$251/Sq Ft
Est. Value
About This Home
This home is located at 608 Sanford Ave, Richland, WA 99352 and is currently estimated at $322,678, approximately $251 per square foot. 608 Sanford Ave is a home located in Benton County with nearby schools including Marcus Whitman Elementary School, Carmichael Middle School, and Richland High School.
Ownership History
Date
Name
Owned For
Owner Type
Purchase Details
Closed on
Dec 1, 2020
Sold by
Anderson Heidi M and Reisenauer Nichole Rima
Bought by
Reisenauer Nichole Rima
Current Estimated Value
Home Financials for this Owner
Home Financials are based on the most recent Mortgage that was taken out on this home.
Original Mortgage
$188,848
Outstanding Balance
$168,431
Interest Rate
2.8%
Mortgage Type
FHA
Estimated Equity
$154,247
Purchase Details
Closed on
Oct 28, 2016
Sold by
Lobe Sevren L and Lobe Teralyn
Bought by
Anderson Heidi M and Anderson Nichole R
Home Financials for this Owner
Home Financials are based on the most recent Mortgage that was taken out on this home.
Original Mortgage
$152,192
Interest Rate
3.25%
Mortgage Type
FHA
Purchase Details
Closed on
Nov 18, 2009
Sold by
Seabaugh Brad and Seabaugh Tera
Bought by
Lobe Sevren L and Lobe Teralyn
Home Financials for this Owner
Home Financials are based on the most recent Mortgage that was taken out on this home.
Original Mortgage
$130,200
Interest Rate
4.83%
Mortgage Type
VA
Create a Home Valuation Report for This Property
The Home Valuation Report is an in-depth analysis detailing your home's value as well as a comparison with similar homes in the area
Home Values in the Area
Average Home Value in this Area
Purchase History
| Date | Buyer | Sale Price | Title Company |
|---|---|---|---|
| Reisenauer Nichole Rima | -- | Chicago Title Company | |
| Anderson Heidi M | $155,000 | Stewart Title Company | |
| Lobe Sevren L | $127,500 | Benton Franklin Title Co |
Source: Public Records
Mortgage History
| Date | Status | Borrower | Loan Amount |
|---|---|---|---|
| Open | Reisenauer Nichole Rima | $188,848 | |
| Closed | Anderson Heidi M | $152,192 | |
| Previous Owner | Lobe Sevren L | $130,200 |
Source: Public Records
Tax History Compared to Growth
Tax History
| Year | Tax Paid | Tax Assessment Tax Assessment Total Assessment is a certain percentage of the fair market value that is determined by local assessors to be the total taxable value of land and additions on the property. | Land | Improvement |
|---|---|---|---|---|
| 2024 | $2,166 | $254,060 | $50,000 | $204,060 |
| 2023 | $2,166 | $229,070 | $50,000 | $179,070 |
| 2022 | $2,041 | $195,760 | $50,000 | $145,760 |
| 2021 | $1,837 | $183,260 | $50,000 | $133,260 |
| 2020 | $1,938 | $158,280 | $50,000 | $108,280 |
| 2019 | $1,599 | $158,100 | $24,000 | $134,100 |
| 2018 | $1,546 | $140,220 | $24,000 | $116,220 |
| 2017 | $1,355 | $113,400 | $24,000 | $89,400 |
| 2016 | $1,336 | $113,400 | $24,000 | $89,400 |
| 2015 | $1,361 | $113,400 | $24,000 | $89,400 |
| 2014 | -- | $113,400 | $24,000 | $89,400 |
| 2013 | -- | $113,400 | $24,000 | $89,400 |
Source: Public Records
Map
Nearby Homes
- 626 Snow Ave
- 713 Sanford Ave
- 513 Winslow Ave
- 503 Wright Ave Unit B8
- 2120 Duportail St Unit 1
- 302 Rossell Ave
- 2109 Duportail St
- 2209 Boise St
- 211 Wright Ave
- 2305 Concord St
- 811 Wright Ave
- 504 Douglass Ave
- 910 Wright Ave
- 405 Basswood Ave
- 2404 Dallas St
- 2402 Dover St
- 1416 Agnes St
- 947 Long Ave
- 1002 Sanford Ave
- 2407 Duportail St