
Seller's Agent in 2014
Kelly Bauer
Coldwell Banker Premier
(540) 336-1069
6 in this area
27 Total Sales
Estimated Value: $262,497 - $302,000
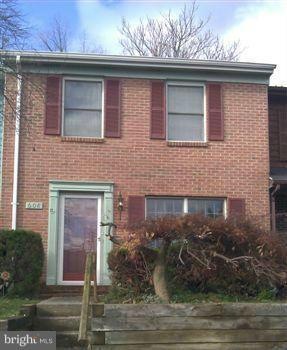
Well maintained 2 bedroom; 1.5 bath town house in Tudor Square; roof replaced 2 years ago; NO polybutelane pipes; all were replaced; hardwood floors throughout; backs to trees; conveniently located near Winchester Medical Center and shopping. Washer and Dryer convey.
Last Agent to Sell the Property
(540) 336-1069 kellybauer@premiermove.com Coldwell Banker Premier License #0225058362 Listed on: 02/10/2014
| Date | Event | Price | List to Sale | Price per Sq Ft |
|---|---|---|---|---|
| 03/14/2014 03/14/14 | Sold | $125,000 | +4.2% | $104 / Sq Ft |
| 02/11/2014 02/11/14 | Price Changed | $120,000 | +0.8% | $100 / Sq Ft |
| 02/10/2014 02/10/14 | Price Changed | $119,000 | -0.8% | $99 / Sq Ft |
| 02/10/2014 02/10/14 | Pending | -- | -- | -- |
| 02/10/2014 02/10/14 | For Sale | $120,000 | 0.0% | $100 / Sq Ft |
| 04/11/2012 04/11/12 | Rented | $850 | -5.6% | -- |
| 04/10/2012 04/10/12 | Under Contract | -- | -- | -- |
| 11/29/2011 11/29/11 | For Rent | $900 | -- | -- |
| Year | Tax Paid | Tax Assessment Tax Assessment Total Assessment is a certain percentage of the fair market value that is determined by local assessors to be the total taxable value of land and additions on the property. | Land | Improvement |
|---|---|---|---|---|
| 2025 | $1,082 | $225,400 | $68,000 | $157,400 |
| 2024 | $456 | $178,900 | $52,000 | $126,900 |
| 2023 | $912 | $178,900 | $52,000 | $126,900 |
| 2022 | $929 | $152,300 | $47,000 | $105,300 |
| 2021 | $929 | $152,300 | $47,000 | $105,300 |
| 2020 | $819 | $134,200 | $47,000 | $87,200 |
| 2019 | $819 | $134,200 | $47,000 | $87,200 |
| 2018 | $724 | $118,700 | $47,000 | $71,700 |
| 2017 | $712 | $118,700 | $47,000 | $71,700 |
| 2016 | $643 | $107,100 | $39,500 | $67,600 |
| 2015 | $600 | $107,100 | $39,500 | $67,600 |
| 2014 | $329 | $98,400 | $34,500 | $63,900 |
Seller's Agent in 2014
Kelly Bauer
Coldwell Banker Premier
(540) 336-1069
6 in this area
27 Total Sales
Buyer's Agent in 2014
Dave Spence
RE/MAX
(540) 974-6634
168 in this area
313 Total Sales
Source: Bright MLS
MLS Number: 1002820630
APN: 53D1-3
Disclaimer: Certain information contained herein is derived from information provided by parties other than Homes.com. All information provided is deemed reliable, but is not guaranteed to be accurate and should be independently verified.
![]() The data relating to real estate for sale on this website appears in part through the BRIGHT Internet Data Exchange program, a voluntary cooperative exchange of property listing data between licensed real estate brokerage firms, and is provided by BRIGHT through a licensing agreement.
The data relating to real estate for sale on this website appears in part through the BRIGHT Internet Data Exchange program, a voluntary cooperative exchange of property listing data between licensed real estate brokerage firms, and is provided by BRIGHT through a licensing agreement.
Listing information is from various brokers who participate in the Bright MLS IDX program and not all listings may be visible on the site.
The property information being provided on or through the website is for the personal, non-commercial use of consumers and such information may not be used for any purpose other than to identify prospective properties consumers may be interested in purchasing.
Some properties which appear for sale on the website may no longer be available because they are for instance, under contract, sold or are no longer being offered for sale.
Property information displayed is deemed reliable but is not guaranteed.
Copyright 2025 Bright MLS, Inc.