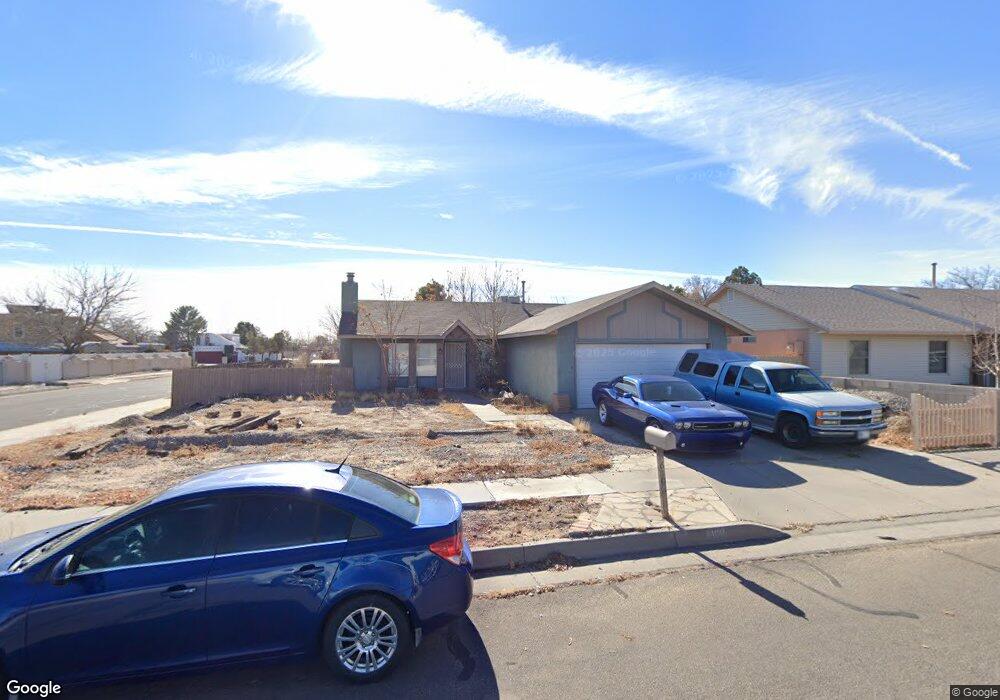
6100 Flor Del Sol Place NW Albuquerque, NM 87120
Taylor Ranch NeighborhoodEstimated Value: $265,000 - $304,000
3
Beds
2
Baths
1,120
Sq Ft
$258/Sq Ft
Est. Value
About This Home
This home is located at 6100 Flor Del Sol Place NW, Albuquerque, NM 87120 and is currently estimated at $288,667, approximately $257 per square foot. 6100 Flor Del Sol Place NW is a home located in Bernalillo County with nearby schools including Marie M. Hughes Elementary School, L.B. Johnson Middle School, and Volcano Vista High School.
Ownership History
Date
Name
Owned For
Owner Type
Purchase Details
Closed on
Aug 24, 2010
Sold by
Baca Bennie G and Baca Melissa L
Bought by
Griego Steven R and Griego Ernestine C
Current Estimated Value
Home Financials for this Owner
Home Financials are based on the most recent Mortgage that was taken out on this home.
Original Mortgage
$135,179
Outstanding Balance
$89,637
Interest Rate
4.6%
Mortgage Type
FHA
Estimated Equity
$199,030
Purchase Details
Closed on
Mar 28, 2001
Sold by
Trujillo Primitivo and Trujillo Viola
Bought by
Baca Bennie G and Baca Melissa L
Home Financials for this Owner
Home Financials are based on the most recent Mortgage that was taken out on this home.
Original Mortgage
$103,984
Interest Rate
6.98%
Create a Home Valuation Report for This Property
The Home Valuation Report is an in-depth analysis detailing your home's value as well as a comparison with similar homes in the area
Home Values in the Area
Average Home Value in this Area
Purchase History
| Date | Buyer | Sale Price | Title Company |
|---|---|---|---|
| Griego Steven R | -- | Rio Grande Title Company Inc | |
| Baca Bennie G | -- | Stewart Title |
Source: Public Records
Mortgage History
| Date | Status | Borrower | Loan Amount |
|---|---|---|---|
| Open | Griego Steven R | $135,179 | |
| Previous Owner | Baca Bennie G | $103,984 |
Source: Public Records
Tax History Compared to Growth
Tax History
| Year | Tax Paid | Tax Assessment Tax Assessment Total Assessment is a certain percentage of the fair market value that is determined by local assessors to be the total taxable value of land and additions on the property. | Land | Improvement |
|---|---|---|---|---|
| 2025 | $2,235 | $54,556 | $12,325 | $42,231 |
| 2024 | $2,235 | $52,968 | $11,966 | $41,002 |
| 2023 | $2,198 | $51,425 | $11,618 | $39,807 |
| 2022 | $2,124 | $49,928 | $11,280 | $38,648 |
| 2021 | $2,052 | $48,474 | $10,951 | $37,523 |
| 2020 | $2,019 | $47,062 | $10,632 | $36,430 |
| 2019 | $1,974 | $46,035 | $11,618 | $34,417 |
| 2018 | $1,904 | $46,035 | $11,618 | $34,417 |
| 2017 | $1,845 | $44,695 | $11,280 | $33,415 |
| 2016 | $1,792 | $42,129 | $10,632 | $31,497 |
| 2015 | $43,429 | $43,429 | $10,632 | $32,797 |
| 2014 | $1,804 | $42,488 | $10,886 | $31,602 |
| 2013 | -- | $41,251 | $10,569 | $30,682 |
Source: Public Records
Map
Nearby Homes
- 5504 Hayes Dr NW
- 6005 Rio Pueblo Dr NW
- 6133 Flor de Mayo Place NW
- 6304 Flor Del Sol Place NW
- 5805 Chimayo Dr NW
- 5143 Gaviota NW
- 5901 Chimayo Dr NW
- 5129 Camino Vista NW
- 0 Unser Blvd NW
- 5101 Tecolote NW
- 6101 Chimayo Dr NW
- 5609 Cambria Rd NW
- 5432 Mariposa Dr NW
- 6615 Astair Ave NW Unit 1
- 6618 Azuelo Ave NW
- 5909 Storyteller Rd NW
- 6705 Lamar Ave NW
- 0 Canada Vista Place NW
- 6720 Lamar Ave NW
- 6020 Jamers Place NW
- 6104 Flor Del Sol Place NW
- 6108 Flor Del Sol Place NW
- 6105 Mustang Ln NW
- 6012 Flor Del Sol Place NW
- 6109 Mustang Ln NW
- 6115 Mustang Ln NW
- 6101 Flor Del Sol Place NW
- 6023 Sweetwater Ct NW
- 6105 Flor Del Sol Place NW
- 6119 Mustang Ln NW
- 6019 Sweetwater Ct NW
- 6008 Flor Del Sol Place NW
- 6112 Flor Del Sol Place NW
- 6109 Flor Del Sol Place NW
- 6123 Mustang Ln NW
- 5500 Sweetwater Dr NW
- 6015 Sweetwater Ct NW
- 6127 Mustang Ln NW
- 6004 Flor Del Sol Place NW
- 6113 Flor Del Sol Place NW