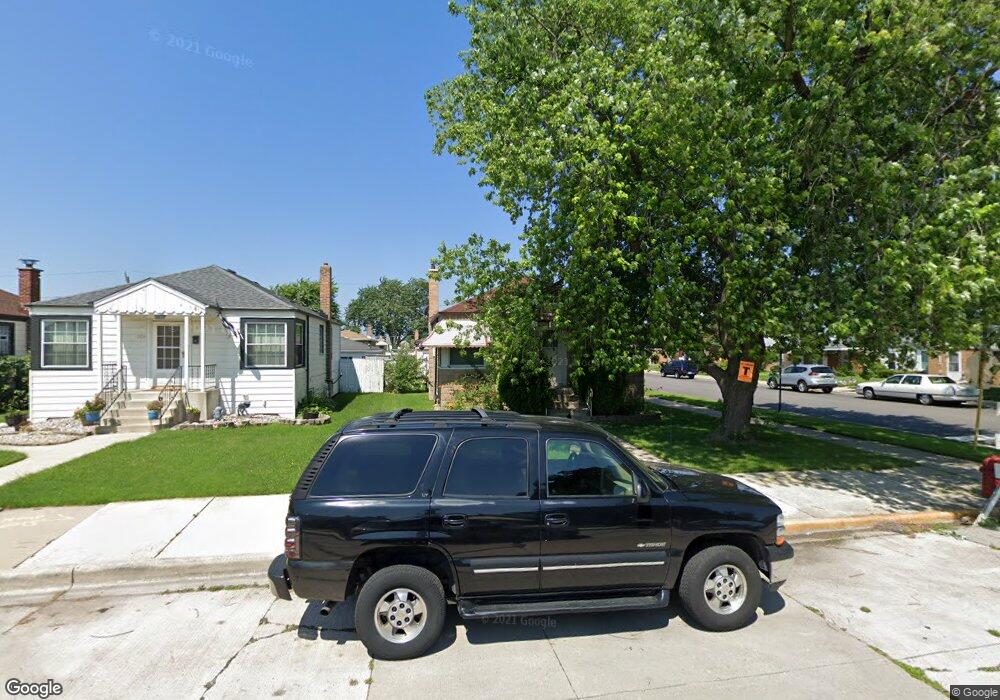
6100 S Natchez Ave Chicago, IL 60638
Clearing NeighborhoodEstimated Value: $261,000 - $315,000
2
Beds
1
Bath
840
Sq Ft
$338/Sq Ft
Est. Value
About This Home
This home is located at 6100 S Natchez Ave, Chicago, IL 60638 and is currently estimated at $283,889, approximately $337 per square foot. 6100 S Natchez Ave is a home located in Cook County with nearby schools including Dore Elementary School, Kennedy High School, and St. Symphorosa Catholic School.
Ownership History
Date
Name
Owned For
Owner Type
Purchase Details
Closed on
May 23, 2009
Sold by
Mejia Rebeca
Bought by
Mejia Alberto and Mejia Rebeca
Current Estimated Value
Home Financials for this Owner
Home Financials are based on the most recent Mortgage that was taken out on this home.
Original Mortgage
$220,095
Outstanding Balance
$142,836
Interest Rate
5.36%
Mortgage Type
FHA
Estimated Equity
$141,053
Purchase Details
Closed on
Dec 23, 2005
Sold by
Piotrowski Tim S
Bought by
Mejia Rebeca
Home Financials for this Owner
Home Financials are based on the most recent Mortgage that was taken out on this home.
Original Mortgage
$178,400
Interest Rate
6.37%
Mortgage Type
Fannie Mae Freddie Mac
Purchase Details
Closed on
Dec 6, 2004
Sold by
Kargol John and Kargol Laura
Bought by
Piotrowski Tim S
Home Financials for this Owner
Home Financials are based on the most recent Mortgage that was taken out on this home.
Original Mortgage
$192,281
Interest Rate
5.82%
Mortgage Type
FHA
Create a Home Valuation Report for This Property
The Home Valuation Report is an in-depth analysis detailing your home's value as well as a comparison with similar homes in the area
Home Values in the Area
Average Home Value in this Area
Purchase History
| Date | Buyer | Sale Price | Title Company |
|---|---|---|---|
| Mejia Alberto | -- | Citywide Title Corporation | |
| Mejia Rebeca | $223,000 | Pntn | |
| Piotrowski Tim S | $195,000 | Professional National Title |
Source: Public Records
Mortgage History
| Date | Status | Borrower | Loan Amount |
|---|---|---|---|
| Open | Mejia Alberto | $220,095 | |
| Previous Owner | Mejia Rebeca | $178,400 | |
| Previous Owner | Piotrowski Tim S | $192,281 |
Source: Public Records
Tax History Compared to Growth
Tax History
| Year | Tax Paid | Tax Assessment Tax Assessment Total Assessment is a certain percentage of the fair market value that is determined by local assessors to be the total taxable value of land and additions on the property. | Land | Improvement |
|---|---|---|---|---|
| 2024 | $2,903 | $25,000 | $6,660 | $18,340 |
| 2023 | $2,809 | $17,000 | $5,946 | $11,054 |
| 2022 | $2,809 | $17,000 | $5,946 | $11,054 |
| 2021 | $2,749 | $16,999 | $5,946 | $11,053 |
| 2020 | $3,130 | $17,060 | $4,757 | $12,303 |
| 2019 | $3,139 | $18,956 | $4,757 | $14,199 |
| 2018 | $3,086 | $18,956 | $4,757 | $14,199 |
| 2017 | $2,525 | $15,026 | $4,281 | $10,745 |
| 2016 | $2,526 | $15,026 | $4,281 | $10,745 |
| 2015 | $2,289 | $15,026 | $4,281 | $10,745 |
| 2014 | $2,390 | $15,349 | $4,043 | $11,306 |
| 2013 | $2,332 | $15,349 | $4,043 | $11,306 |
Source: Public Records
Map
Nearby Homes
- 6104 S Nashville Ave
- 6020 S Nashville Ave
- 6206 S Nashville Ave
- 6031 S Normandy Ave
- 5950 S Natoma Ave
- 6709 W 59th St
- 6322 W 63rd Place
- 6046 S Melvina Ave
- 6416 W 64th Place Unit 3A
- 6430 W 64th Place
- 6004 S Moody Ave
- 6401 W 64th Place Unit 2W
- 5820 S Rutherford Ave
- 6154 W 63rd St Unit 3W
- 6105 S Moody Ave
- 6637 W 64th Place
- 6659 W 64th Place Unit 305
- 6419 S Oak Park Ave Unit E-25
- 6122 W 59th St
- 5914 S Meade Ave
- 6104 S Natchez Ave
- 6108 S Natchez Ave
- 6112 S Natchez Ave
- 6101 S Neenah Ave
- 6101 S Neenah Ave
- 6504 W 61st St
- 6107 S Neenah Ave
- 6116 S Natchez Ave
- 6508 W 61st St
- 6500 W 61st St
- 6109 S Neenah Ave
- 6512 W 61st St
- 6115 S Neenah Ave
- 6516 W 61st St
- 6120 S Natchez Ave
- 6101 S Natchez Ave
- 6105 S Natchez Ave
- 6117 S Neenah Ave
- 6520 W 61st St
- 6109 S Natchez Ave