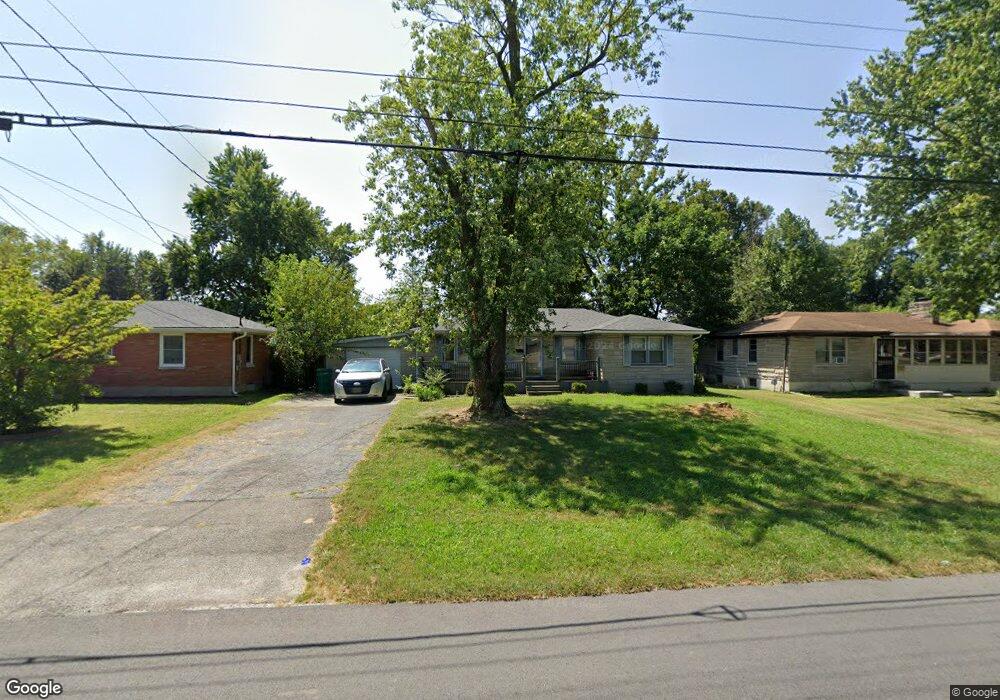
6102 Morning Glory Ln Louisville, KY 40258
Pleasure Ridge Park NeighborhoodEstimated Value: $222,000 - $261,240
3
Beds
1
Bath
2,093
Sq Ft
$118/Sq Ft
Est. Value
About This Home
This home is located at 6102 Morning Glory Ln, Louisville, KY 40258 and is currently estimated at $247,310, approximately $118 per square foot. 6102 Morning Glory Ln is a home located in Jefferson County with nearby schools including Wilkerson Elementary School, Shacklette Elementary School, and Sanders Elementary School.
Ownership History
Date
Name
Owned For
Owner Type
Purchase Details
Closed on
Apr 21, 2016
Sold by
Gurley Vickie
Bought by
Halbleib Edith F
Current Estimated Value
Home Financials for this Owner
Home Financials are based on the most recent Mortgage that was taken out on this home.
Original Mortgage
$100,000
Outstanding Balance
$79,522
Interest Rate
3.71%
Mortgage Type
Balloon
Estimated Equity
$167,788
Purchase Details
Closed on
Nov 4, 2014
Sold by
Gurley Vickie and Gurley Dennis L
Bought by
Gurley Vickie
Purchase Details
Closed on
Jul 12, 2007
Sold by
Taylor Eric M and Taylor Tiffaney C
Bought by
Green Marlene and Gurley Vickie J
Home Financials for this Owner
Home Financials are based on the most recent Mortgage that was taken out on this home.
Original Mortgage
$134,200
Interest Rate
6.37%
Mortgage Type
Purchase Money Mortgage
Purchase Details
Closed on
Jan 23, 2001
Sold by
Coover Delores A
Bought by
Taylor Eric M and Mccormick Tiffaney C
Create a Home Valuation Report for This Property
The Home Valuation Report is an in-depth analysis detailing your home's value as well as a comparison with similar homes in the area
Home Values in the Area
Average Home Value in this Area
Purchase History
| Date | Buyer | Sale Price | Title Company |
|---|---|---|---|
| Halbleib Edith F | $66,334 | None Available | |
| Gurley Vickie | -- | Source Of Title | |
| Green Marlene | $134,200 | Nations Title | |
| Taylor Eric M | $113,875 | -- |
Source: Public Records
Mortgage History
| Date | Status | Borrower | Loan Amount |
|---|---|---|---|
| Open | Halbleib Edith F | $100,000 | |
| Previous Owner | Green Marlene | $134,200 |
Source: Public Records
Tax History Compared to Growth
Tax History
| Year | Tax Paid | Tax Assessment Tax Assessment Total Assessment is a certain percentage of the fair market value that is determined by local assessors to be the total taxable value of land and additions on the property. | Land | Improvement |
|---|---|---|---|---|
| 2024 | $2,511 | $215,500 | $22,500 | $193,000 |
| 2023 | $2,582 | $215,500 | $22,500 | $193,000 |
| 2022 | $2,007 | $166,930 | $20,000 | $146,930 |
| 2021 | $2,162 | $166,930 | $20,000 | $146,930 |
| 2020 | $1,931 | $166,930 | $20,000 | $146,930 |
| 2019 | $1,893 | $166,930 | $20,000 | $146,930 |
| 2018 | $743 | $66,330 | $25,000 | $41,330 |
| 2017 | $696 | $66,330 | $25,000 | $41,330 |
| 2013 | $1,287 | $128,740 | $25,000 | $103,740 |
Source: Public Records
Map
Nearby Homes
- 8004 Canna Dr
- 8108 Poinsettia Dr
- 569 Paradise Ln
- 7903 Columbine Dr
- 6304 Player Dr
- 6102 Goalby Dr
- 6123 Casper Dr
- 5901 Jessamine Ln
- 6116 Goalby Dr
- 6302 Casper Dr
- 8100 Terry Rd
- 5605 Tamarack Ln
- 8296 Terry Rd
- 7906 Daffodil Dr
- 5513 Tamarack Ln
- 6205 Manse Dr
- 7716 Jonquil Dr
- 8516 Thompson Ln
- 5604 W Pages Ln
- 5657 David Ln
- 6010 Morning Glory Ln
- 6104 Morning Glory Ln
- 5817 Teakwood Ln
- 6008 Morning Glory Ln
- 5819 Teakwood Ln
- 6106 Morning Glory Ln
- 5815 Teakwood Ln
- 6101 Morning Glory Ln
- 6006 Morning Glory Ln
- 8108 Madrone Ave
- 6108 Morning Glory Ln
- 6103 Morning Glory Ln
- 5813 Teakwood Ln
- 8016 Trillium Dr
- 6003 Morning Glory Ln
- 6004 Morning Glory Ln
- 8017 Canna Dr
- 5816 Teakwood Ln
- 8113 Madrone Ave
- 8017 Trillium Dr