

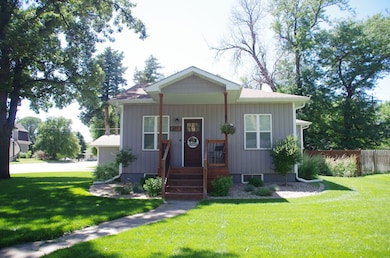
611 N 9th Ave Broken Bow, NE 68822
Estimated payment $2,066/month
Total Views
870
0
Acre
--
Price per Acre
0
Sq Ft Lot
About This Lot
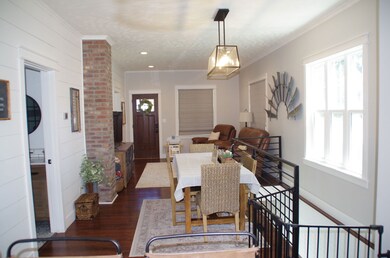
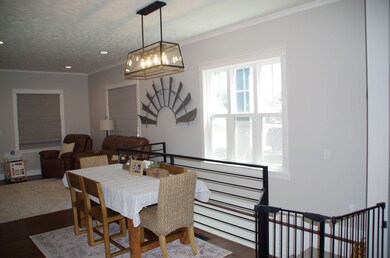
Home For SaleAbsolutely Adorable!!!This home has been completely renovated, including plumbing, electrical work, HVAC, a Daykin unit, a tankless water heater, and a Culligan soft water system. It features a poured concrete foundation with 9-foot basement walls, Pella windows, new drywall, exterior and interior doors, baseboards, and flooring throughout.
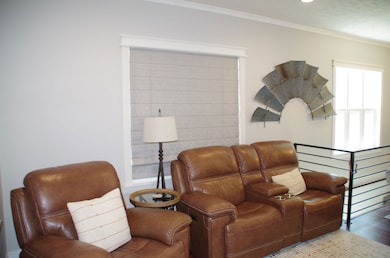
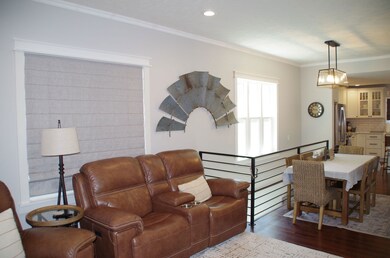
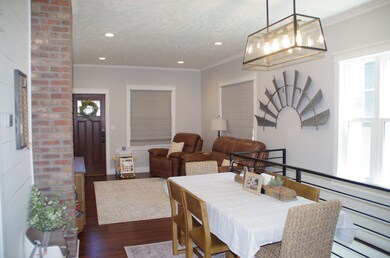
The very open floor plan boasts waterproof laminated wood flooring. The kitchen is equipped with white wooden cabinets, GE stainless steel appliances, a subway tile backsplash, a farmhouse sink, quartz countertops, and an island.
The main bathroom includes a tiled walk-in shower and a beautiful ceramic tile floor with heating.
There are 2 bedrooms on the main floor. The master bedroom features a walk-in closet with a stylish barn door.
The laundry room is conveniently located off the kitchen, and the LG washer and dryer will remain with the home.
The lower level includes 2 additional bedrooms, both with egress windows, a second bathroom, a family room, and a storage room.
A patio door leads out to the deck and the fenced-in backyard, which offers a privacy fence and a utility shed. The corner lot includes underground sprinklers, continuous concrete curbing, and landscaping with a drip irrigation system.
The oversized insulated double garage comes with a new Midland 18-foot garage door.
This home is located close to schools!
Farmers Company
Listed on: 07/07/2025
Listing Provided By
Property Details
Property Type
- Land
Est. Annual Taxes
- $2,196
Utilities
- Well
Map
Create a Home Valuation Report for This Property
The Home Valuation Report is an in-depth analysis detailing your home's value as well as a comparison with similar homes in the area
Home Values in the Area
Average Home Value in this Area
Tax History
| Year | Tax Paid | Tax Assessment Tax Assessment Total Assessment is a certain percentage of the fair market value that is determined by local assessors to be the total taxable value of land and additions on the property. | Land | Improvement |
|---|---|---|---|---|
| 2024 | $2,196 | $160,252 | $13,702 | $146,550 |
| 2023 | $2,261 | $144,339 | $13,702 | $130,637 |
| 2022 | $2,669 | $145,443 | $13,702 | $131,741 |
| 2021 | $1,038 | $57,880 | $12,845 | $45,035 |
| 2020 | $1,029 | $57,880 | $12,845 | $45,035 |
| 2019 | $1,005 | $56,621 | $6,421 | $50,200 |
| 2017 | $781 | $42,785 | $6,421 | $36,364 |
| 2016 | $810 | $40,559 | $4,195 | $36,364 |
| 2015 | $785 | $38,937 | $4,147 | $34,790 |
| 2014 | $785 | $35,397 | $3,770 | $31,627 |
Source: Public Records
Property History
| Date | Event | Price | Change | Sq Ft Price |
|---|---|---|---|---|
| 07/04/2025 07/04/25 | For Sale | $339,900 | -- | $169 / Sq Ft |
Purchase History
| Date | Type | Sale Price | Title Company |
|---|---|---|---|
| Grant Deed | $60,000 | -- |
Source: Public Records
Similar Properties in Broken Bow, NE
Nearby Homes