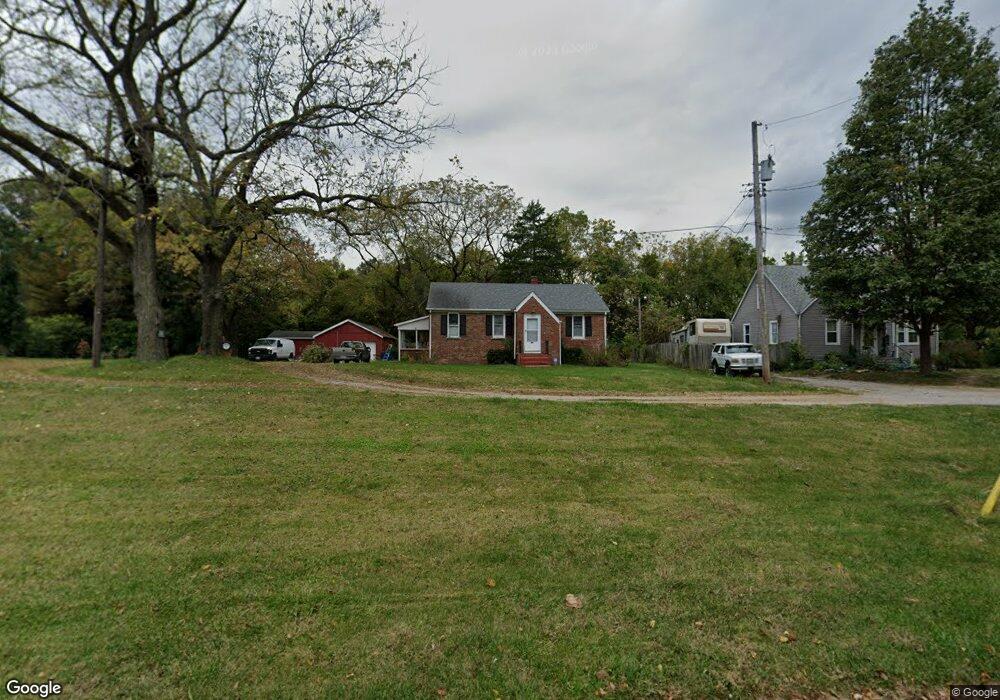
6112 Old Saint Louis Rd Belleville, IL 62223
Estimated Value: $122,000 - $173,765
2
Beds
1
Bath
1,033
Sq Ft
$141/Sq Ft
Est. Value
About This Home
This home is located at 6112 Old Saint Louis Rd, Belleville, IL 62223 and is currently estimated at $145,941, approximately $141 per square foot. 6112 Old Saint Louis Rd is a home located in St. Clair County with nearby schools including Ellis Elementary School, Emge Junior High School, and Our Lady Queen Of Peace Catholic School.
Ownership History
Date
Name
Owned For
Owner Type
Purchase Details
Closed on
Sep 22, 2010
Sold by
First Federal Savings Bank Of Mascoutah
Bought by
Reeb Stephen E and Reeb Beverly A
Current Estimated Value
Home Financials for this Owner
Home Financials are based on the most recent Mortgage that was taken out on this home.
Original Mortgage
$65,000
Interest Rate
5.67%
Mortgage Type
Seller Take Back
Purchase Details
Closed on
Oct 22, 2008
Sold by
Averett Robert D and Averett Jill S
Bought by
First Federal Savings Bank Of Mascoutah
Purchase Details
Closed on
Jun 14, 2006
Sold by
Us Bank Na
Bought by
Averett Robert D and Averett Jill
Home Financials for this Owner
Home Financials are based on the most recent Mortgage that was taken out on this home.
Original Mortgage
$82,000
Interest Rate
6.75%
Mortgage Type
Purchase Money Mortgage
Purchase Details
Closed on
Mar 14, 2006
Sold by
Vahlkamp Kevin Ray
Bought by
Us Bank Na
Create a Home Valuation Report for This Property
The Home Valuation Report is an in-depth analysis detailing your home's value as well as a comparison with similar homes in the area
Home Values in the Area
Average Home Value in this Area
Purchase History
| Date | Buyer | Sale Price | Title Company |
|---|---|---|---|
| Reeb Stephen E | $40,000 | Metro East Title Corporation | |
| First Federal Savings Bank Of Mascoutah | -- | None Available | |
| Averett Robert D | -- | Wheatland Title | |
| Us Bank Na | -- | None Available |
Source: Public Records
Mortgage History
| Date | Status | Borrower | Loan Amount |
|---|---|---|---|
| Closed | Reeb Stephen E | $65,000 | |
| Previous Owner | Averett Robert D | $82,000 |
Source: Public Records
Tax History Compared to Growth
Tax History
| Year | Tax Paid | Tax Assessment Tax Assessment Total Assessment is a certain percentage of the fair market value that is determined by local assessors to be the total taxable value of land and additions on the property. | Land | Improvement |
|---|---|---|---|---|
| 2024 | $4,070 | $48,310 | $11,631 | $36,679 |
| 2023 | $3,808 | $43,347 | $10,436 | $32,911 |
| 2022 | $3,622 | $39,335 | $9,470 | $29,865 |
| 2021 | $3,497 | $36,520 | $8,793 | $27,727 |
| 2020 | $3,630 | $36,691 | $8,554 | $28,137 |
| 2019 | $3,631 | $36,691 | $8,554 | $28,137 |
| 2018 | $3,521 | $35,061 | $8,174 | $26,887 |
| 2017 | $3,026 | $32,653 | $7,613 | $25,040 |
| 2016 | $2,751 | $28,006 | $5,334 | $22,672 |
| 2014 | $2,497 | $28,167 | $5,365 | $22,802 |
| 2013 | $2,454 | $30,051 | $5,724 | $24,327 |
Source: Public Records
Map
Nearby Homes
- 18 Jonathon Lee Dr
- 130 Hickory Lake
- 6204 Warren Dr
- 2819 Frank Scott Pkwy W
- 40 Irene Dr
- 41 Paulette Dr
- 57 Cheshire Dr
- 22 Terrace Dr
- 22 Elizabeth Dr
- 102 Kensington Heights Rd
- 11 Kingsway Dr
- 408 Rosewood Ct
- 119 Freedom Dr
- 128 Freedom Dr
- 4720 Ruth St
- 4619 Ruth St
- 44 Gatewood Ct
- 2264 Frank Scott Pkwy W
- 8 S 51st St
- 11 Pinecrest Cir
- 6108 Old Saint Louis Rd
- 101 Warrensburg Dr
- 131 Lake Hickory Cir
- 127 Lake Hickory Cir
- 123 Lake Hickory Cir
- 96 Warrensburg Dr
- 109 Warrensburg Dr
- 100 Warrensburg Dr
- 115 Lake Hickory Cir
- 113 Warrensburg Dr
- 104 Warrensburg Dr
- 111 Lake Hickory Cir
- 209 Warrensburg Dr
- 18 Woodhaven Ct
- 213 Warrensburg Dr
- 305 Fredericksburg Dr
- 300 Fredericksburg Dr
- 22 Woodhaven Ct
- 107 Lake Hickory Cir
- 107 Lake Hickory Cir