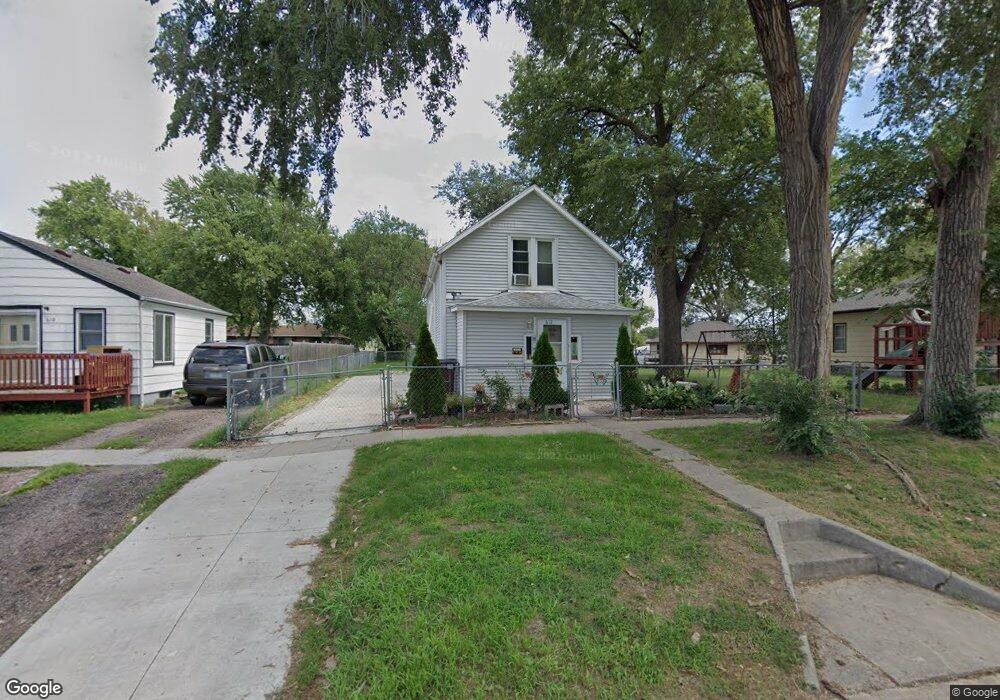
612 3rd Ave South Sioux City, NE 68776
Estimated Value: $162,330 - $207,000
3
Beds
1
Bath
1,512
Sq Ft
$117/Sq Ft
Est. Value
About This Home
This home is located at 612 3rd Ave, South Sioux City, NE 68776 and is currently estimated at $176,833, approximately $116 per square foot. 612 3rd Ave is a home located in Dakota County with nearby schools including Lewis & Clark Elementary School, South Sioux City Middle School, and South Sioux Senior High School.
Ownership History
Date
Name
Owned For
Owner Type
Purchase Details
Closed on
Dec 30, 2010
Sold by
Cano Maria A
Bought by
Polanco Sandra C Magana
Current Estimated Value
Home Financials for this Owner
Home Financials are based on the most recent Mortgage that was taken out on this home.
Original Mortgage
$48,732
Outstanding Balance
$33,176
Interest Rate
4.75%
Mortgage Type
FHA
Estimated Equity
$143,657
Purchase Details
Closed on
Apr 5, 2000
Sold by
Murguia Enrique and Murguia Margarita
Bought by
Cano Maria A
Create a Home Valuation Report for This Property
The Home Valuation Report is an in-depth analysis detailing your home's value as well as a comparison with similar homes in the area
Home Values in the Area
Average Home Value in this Area
Purchase History
| Date | Buyer | Sale Price | Title Company |
|---|---|---|---|
| Polanco Sandra C Magana | $50,000 | -- | |
| Cano Maria A | $25,000 | -- |
Source: Public Records
Mortgage History
| Date | Status | Borrower | Loan Amount |
|---|---|---|---|
| Open | Polanco Sandra C Magana | $48,732 |
Source: Public Records
Tax History Compared to Growth
Tax History
| Year | Tax Paid | Tax Assessment Tax Assessment Total Assessment is a certain percentage of the fair market value that is determined by local assessors to be the total taxable value of land and additions on the property. | Land | Improvement |
|---|---|---|---|---|
| 2024 | $1,463 | $111,915 | $12,960 | $98,955 |
| 2023 | $1,766 | $99,465 | $7,775 | $91,690 |
| 2022 | $1,766 | $92,325 | $7,775 | $84,550 |
| 2021 | $1,624 | $81,940 | $7,775 | $74,165 |
| 2020 | $1,638 | $81,940 | $7,775 | $74,165 |
| 2019 | $1,668 | $83,210 | $7,775 | $75,435 |
| 2018 | $1,626 | $80,445 | $7,775 | $72,670 |
| 2017 | $1,459 | $72,325 | $7,775 | $64,550 |
| 2016 | $1,065 | $53,705 | $7,775 | $45,930 |
| 2014 | $958 | $46,535 | $8,160 | $38,375 |
Source: Public Records
Map
Nearby Homes