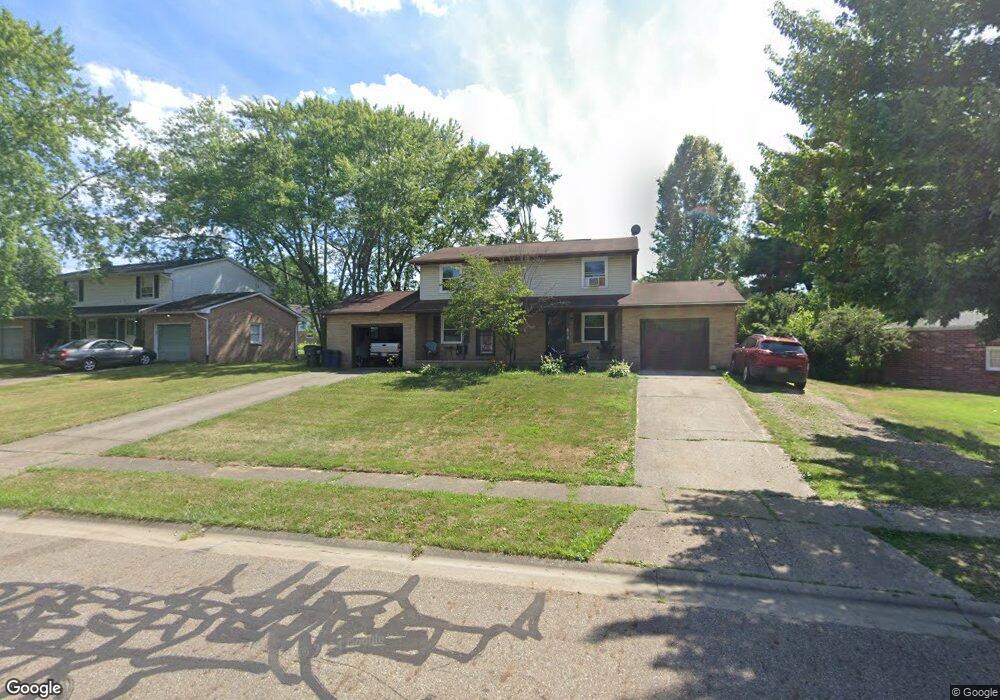
612 Taff Cir Louisville, OH 44641
Estimated Value: $197,000 - $225,862
4
Beds
2
Baths
1,890
Sq Ft
$111/Sq Ft
Est. Value
About This Home
This home is located at 612 Taff Cir, Louisville, OH 44641 and is currently estimated at $209,466, approximately $110 per square foot. 612 Taff Cir is a home located in Stark County with nearby schools including Louisville High School and St. Thomas Aquinas High School & Middle School.
Ownership History
Date
Name
Owned For
Owner Type
Purchase Details
Closed on
Oct 28, 2024
Sold by
Cherukuri Balakrishna and Makey Dayavathi
Bought by
Mmc Partners Llc
Current Estimated Value
Purchase Details
Closed on
Aug 7, 2023
Sold by
Masters Drake A
Bought by
Cherukuri Balakrishna and Makey Dayavathi
Home Financials for this Owner
Home Financials are based on the most recent Mortgage that was taken out on this home.
Original Mortgage
$130,125
Interest Rate
6.67%
Mortgage Type
New Conventional
Purchase Details
Closed on
May 11, 2018
Sold by
Borsellino Mickey J and Borsellino Janette M
Bought by
Masters Drake A
Home Financials for this Owner
Home Financials are based on the most recent Mortgage that was taken out on this home.
Original Mortgage
$117,727
Interest Rate
4.75%
Mortgage Type
FHA
Purchase Details
Closed on
Dec 21, 1992
Purchase Details
Closed on
Mar 27, 1989
Create a Home Valuation Report for This Property
The Home Valuation Report is an in-depth analysis detailing your home's value as well as a comparison with similar homes in the area
Home Values in the Area
Average Home Value in this Area
Purchase History
| Date | Buyer | Sale Price | Title Company |
|---|---|---|---|
| Mmc Partners Llc | -- | None Listed On Document | |
| Cherukuri Balakrishna | $173,500 | Patriot Title | |
| Masters Drake A | $119,900 | None Available | |
| -- | $72,500 | -- | |
| -- | $65,000 | -- |
Source: Public Records
Mortgage History
| Date | Status | Borrower | Loan Amount |
|---|---|---|---|
| Previous Owner | Cherukuri Balakrishna | $130,125 | |
| Previous Owner | Masters Drake A | $117,727 |
Source: Public Records
Tax History Compared to Growth
Tax History
| Year | Tax Paid | Tax Assessment Tax Assessment Total Assessment is a certain percentage of the fair market value that is determined by local assessors to be the total taxable value of land and additions on the property. | Land | Improvement |
|---|---|---|---|---|
| 2025 | -- | $63,700 | $18,830 | $44,870 |
| 2024 | -- | $63,700 | $18,830 | $44,870 |
| 2023 | $2,070 | $47,810 | $18,690 | $29,120 |
| 2022 | $2,076 | $47,810 | $18,690 | $29,120 |
| 2021 | $2,081 | $47,810 | $18,690 | $29,120 |
| 2020 | $1,750 | $43,610 | $16,800 | $26,810 |
| 2019 | $1,752 | $48,440 | $16,800 | $31,640 |
| 2018 | $1,983 | $48,440 | $16,800 | $31,640 |
| 2017 | $1,834 | $43,240 | $13,730 | $29,510 |
| 2016 | $1,872 | $43,240 | $13,730 | $29,510 |
| 2015 | $1,877 | $43,240 | $13,730 | $29,510 |
| 2014 | $1,743 | $37,320 | $11,870 | $25,450 |
| 2013 | $875 | $37,320 | $11,870 | $25,450 |
Source: Public Records
Map
Nearby Homes
- 908 Sand Lot Cir
- 1702 View Pointe Ave
- 1639 Horizon Dr
- 510 S Bauman Ct
- 728 E Broad St
- 520 S Silver St
- 204 E Broad St
- 641 S Nickelplate St
- 107 E Broad St
- 308 Superior St
- 8225 Georgetown St
- 1715 High St
- 2110 Edmar St
- 1812 E Broad St
- 325 Lincoln Ave
- 6969 Georgetown St NE
- 3390 Meese Rd NE
- 0 Michigan Blvd
- 2425 Miday Ave NE
- 201 Indiana Ave
- 610 & 612 Taff Cir
- 418 Beechwood St
- 420 Beechwood St
- 622 Taff Cir
- 509 Navaho St
- 501 Navaho St
- 519 Navaho St
- 415 Navaho St
- 404 Beechwood St
- 615 Taff Cir
- 605 Taff Cir
- 623 Taff Cir
- 603 Navaho St
- 405 Navaho St
- 519 Taff Cir
- 519 Taff Cir Unit A
- 310 Beechwood St
- 310 Beechwood St Unit 1
- 705 Taff Cir
- 511 Taff Cir