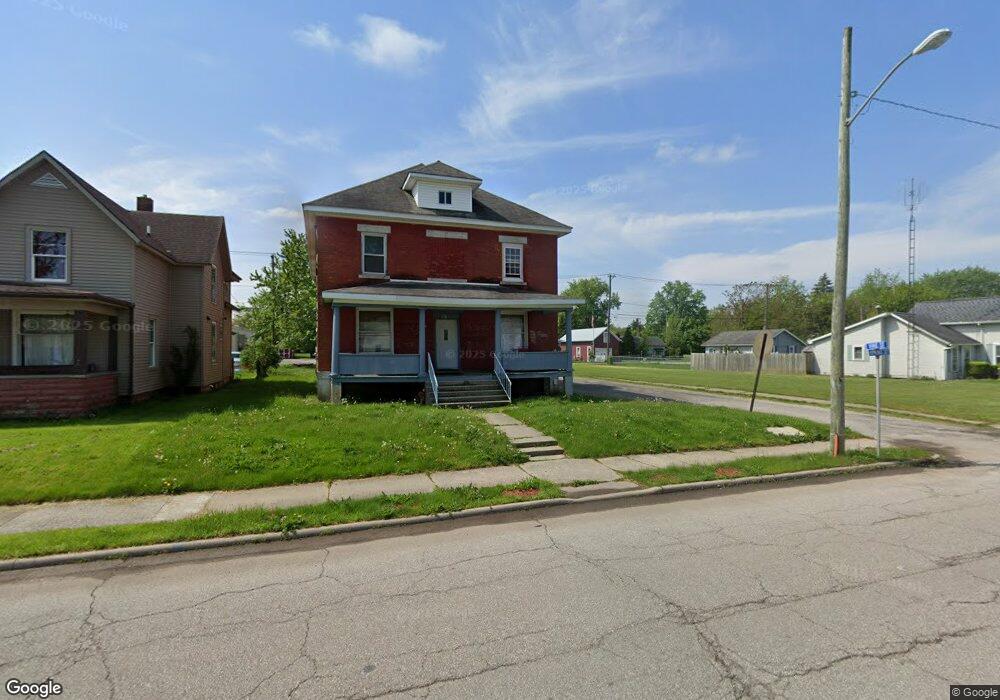
612 Vine St Defiance, OH 43512
Estimated Value: $104,000 - $161,000
2
Beds
1
Bath
1,440
Sq Ft
$88/Sq Ft
Est. Value
About This Home
This home is located at 612 Vine St, Defiance, OH 43512 and is currently estimated at $126,604, approximately $87 per square foot. 612 Vine St is a home located in Defiance County with nearby schools including Defiance Elementary School, Defiance Middle School, and Defiance High School.
Ownership History
Date
Name
Owned For
Owner Type
Purchase Details
Closed on
Jul 17, 2019
Sold by
Albright Linda and Albright Linda K
Bought by
Albright Linda K
Current Estimated Value
Home Financials for this Owner
Home Financials are based on the most recent Mortgage that was taken out on this home.
Original Mortgage
$143,250
Outstanding Balance
$124,473
Interest Rate
3.43%
Mortgage Type
Reverse Mortgage Home Equity Conversion Mortgage
Estimated Equity
$2,131
Purchase Details
Closed on
Dec 12, 2000
Bought by
Albright Linda K
Create a Home Valuation Report for This Property
The Home Valuation Report is an in-depth analysis detailing your home's value as well as a comparison with similar homes in the area
Home Values in the Area
Average Home Value in this Area
Purchase History
| Date | Buyer | Sale Price | Title Company |
|---|---|---|---|
| Albright Linda K | -- | None Available | |
| Albright Linda K | -- | -- |
Source: Public Records
Mortgage History
| Date | Status | Borrower | Loan Amount |
|---|---|---|---|
| Open | Albright Linda K | $143,250 |
Source: Public Records
Tax History Compared to Growth
Tax History
| Year | Tax Paid | Tax Assessment Tax Assessment Total Assessment is a certain percentage of the fair market value that is determined by local assessors to be the total taxable value of land and additions on the property. | Land | Improvement |
|---|---|---|---|---|
| 2024 | $798 | $31,040 | $7,120 | $23,920 |
| 2023 | $798 | $31,040 | $7,120 | $23,920 |
| 2022 | $849 | $28,950 | $6,980 | $21,970 |
| 2021 | $849 | $28,950 | $6,980 | $21,970 |
| 2020 | $856 | $28,950 | $6,980 | $21,970 |
| 2019 | $769 | $26,490 | $6,980 | $19,510 |
| 2018 | $748 | $26,490 | $6,980 | $19,510 |
| 2017 | $737 | $26,488 | $6,982 | $19,506 |
| 2016 | $722 | $25,592 | $7,017 | $18,575 |
| 2015 | $467 | $24,559 | $7,017 | $17,542 |
| 2014 | $467 | $24,559 | $7,017 | $17,542 |
| 2013 | $467 | $24,559 | $7,017 | $17,542 |
| 2012 | $467 | $24,560 | $7,018 | $17,542 |
Source: Public Records
Map
Nearby Homes