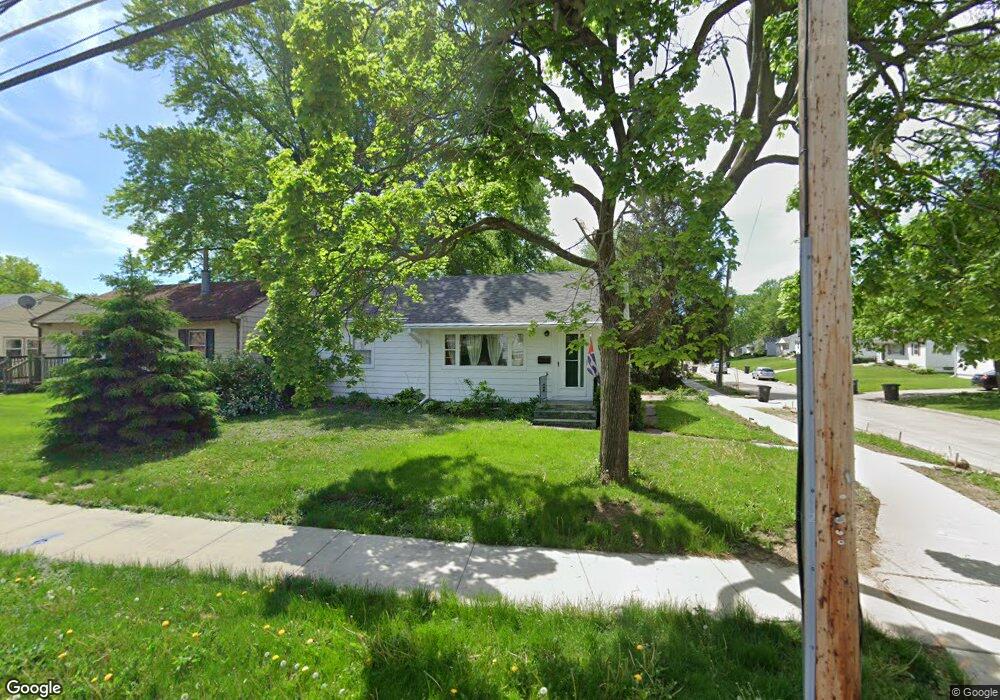
6120 Clark St Des Moines, IA 50311
Merle Hay NeighborhoodEstimated Value: $183,000 - $208,794
2
Beds
1
Bath
864
Sq Ft
$228/Sq Ft
Est. Value
About This Home
This home is located at 6120 Clark St, Des Moines, IA 50311 and is currently estimated at $196,949, approximately $227 per square foot. 6120 Clark St is a home located in Polk County with nearby schools including Windsor Elementary School, Merrill Middle School, and Roosevelt High School.
Ownership History
Date
Name
Owned For
Owner Type
Purchase Details
Closed on
Sep 29, 2017
Sold by
Acheson Dale E and Acheson Madeline K
Bought by
Neil Megan Glenn O
Current Estimated Value
Home Financials for this Owner
Home Financials are based on the most recent Mortgage that was taken out on this home.
Original Mortgage
$116,640
Outstanding Balance
$97,377
Interest Rate
3.89%
Mortgage Type
New Conventional
Estimated Equity
$99,573
Purchase Details
Closed on
Dec 16, 2010
Sold by
Kister Marvin G and Estate Of Phyllis V Whalen
Bought by
Acheson Dale E and Acheson Madeline K
Create a Home Valuation Report for This Property
The Home Valuation Report is an in-depth analysis detailing your home's value as well as a comparison with similar homes in the area
Home Values in the Area
Average Home Value in this Area
Purchase History
| Date | Buyer | Sale Price | Title Company |
|---|---|---|---|
| Neil Megan Glenn O | $121,500 | None Available | |
| Acheson Dale E | -- | None Available |
Source: Public Records
Mortgage History
| Date | Status | Borrower | Loan Amount |
|---|---|---|---|
| Open | Neil Megan Glenn O | $116,640 |
Source: Public Records
Tax History Compared to Growth
Tax History
| Year | Tax Paid | Tax Assessment Tax Assessment Total Assessment is a certain percentage of the fair market value that is determined by local assessors to be the total taxable value of land and additions on the property. | Land | Improvement |
|---|---|---|---|---|
| 2025 | $3,030 | $183,800 | $47,400 | $136,400 |
| 2024 | $3,030 | $164,500 | $41,800 | $122,700 |
| 2023 | $3,170 | $164,500 | $41,800 | $122,700 |
| 2022 | $3,144 | $143,400 | $37,700 | $105,700 |
| 2021 | $2,998 | $143,400 | $37,700 | $105,700 |
| 2020 | $3,108 | $128,700 | $33,600 | $95,100 |
| 2019 | $2,838 | $128,700 | $33,600 | $95,100 |
| 2018 | $3,036 | $114,100 | $29,300 | $84,800 |
| 2017 | $2,738 | $114,100 | $29,300 | $84,800 |
| 2016 | $2,666 | $101,200 | $25,600 | $75,600 |
| 2015 | $2,666 | $101,200 | $25,600 | $75,600 |
| 2014 | $2,434 | $91,600 | $22,800 | $68,800 |
Source: Public Records
Map
Nearby Homes