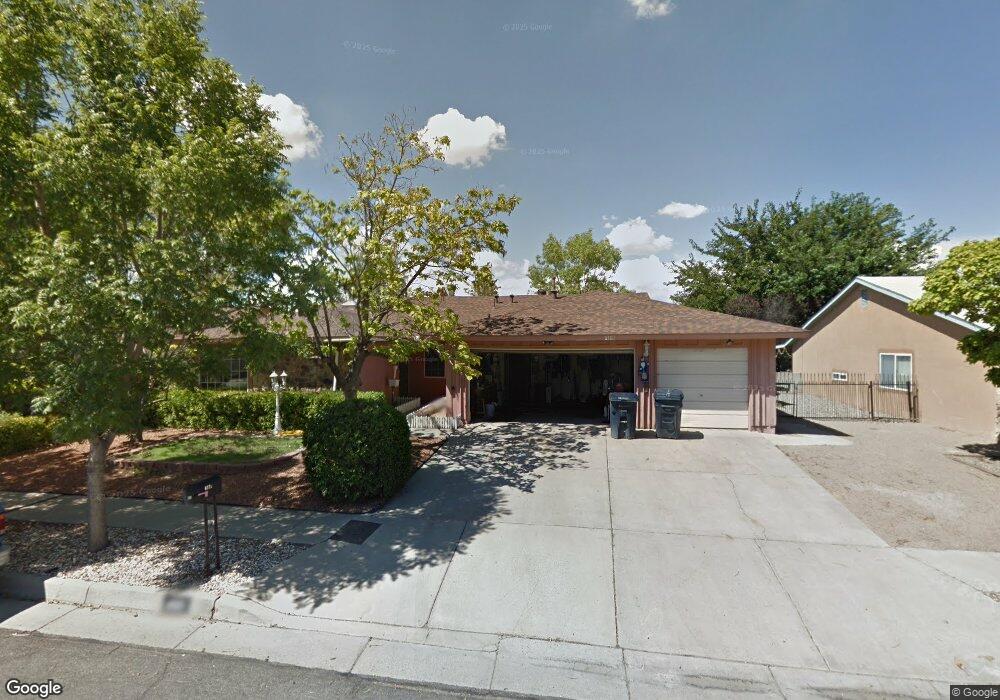
6121 Buenos Aires Place NW Albuquerque, NM 87120
Taylor Ranch NeighborhoodEstimated Value: $344,000 - $362,000
4
Beds
2
Baths
1,966
Sq Ft
$179/Sq Ft
Est. Value
About This Home
This home is located at 6121 Buenos Aires Place NW, Albuquerque, NM 87120 and is currently estimated at $352,877, approximately $179 per square foot. 6121 Buenos Aires Place NW is a home located in Bernalillo County with nearby schools including Marie M. Hughes Elementary School, L.B. Johnson Middle School, and Volcano Vista High School.
Ownership History
Date
Name
Owned For
Owner Type
Purchase Details
Closed on
Nov 3, 2005
Sold by
Katzer Michael T and Katzer Grace
Bought by
Sheyka James M and Sheyka Maryann
Current Estimated Value
Home Financials for this Owner
Home Financials are based on the most recent Mortgage that was taken out on this home.
Original Mortgage
$160,000
Outstanding Balance
$85,585
Interest Rate
5.75%
Mortgage Type
Fannie Mae Freddie Mac
Estimated Equity
$267,292
Purchase Details
Closed on
Jan 31, 2000
Sold by
Associates Relocation Management Co Inc
Bought by
Katzer Michael T and Katzer Grace M
Home Financials for this Owner
Home Financials are based on the most recent Mortgage that was taken out on this home.
Original Mortgage
$130,458
Interest Rate
7.86%
Mortgage Type
VA
Purchase Details
Closed on
Sep 17, 1999
Sold by
Smith David G
Bought by
Associates Relocation Management Co Inc
Create a Home Valuation Report for This Property
The Home Valuation Report is an in-depth analysis detailing your home's value as well as a comparison with similar homes in the area
Home Values in the Area
Average Home Value in this Area
Purchase History
| Date | Buyer | Sale Price | Title Company |
|---|---|---|---|
| Sheyka James M | -- | Landamerica Albuquerque Titl | |
| Katzer Michael T | -- | Rio Grande Title Co Inc | |
| Associates Relocation Management Co Inc | -- | Rio Grande Title Company Inc |
Source: Public Records
Mortgage History
| Date | Status | Borrower | Loan Amount |
|---|---|---|---|
| Open | Sheyka James M | $160,000 | |
| Previous Owner | Katzer Michael T | $130,458 |
Source: Public Records
Tax History Compared to Growth
Tax History
| Year | Tax Paid | Tax Assessment Tax Assessment Total Assessment is a certain percentage of the fair market value that is determined by local assessors to be the total taxable value of land and additions on the property. | Land | Improvement |
|---|---|---|---|---|
| 2025 | $2,663 | $71,188 | $13,480 | $57,708 |
| 2024 | $2,663 | $69,114 | $13,087 | $56,027 |
| 2023 | $2,611 | $67,101 | $12,706 | $54,395 |
| 2022 | $2,516 | $65,147 | $12,336 | $52,811 |
| 2021 | $2,424 | $63,250 | $11,977 | $51,273 |
| 2020 | $2,377 | $61,409 | $11,629 | $49,780 |
| 2019 | $2,299 | $59,620 | $11,290 | $48,330 |
| 2018 | $2,210 | $59,620 | $11,290 | $48,330 |
| 2017 | $2,135 | $57,883 | $10,961 | $46,922 |
| 2016 | $2,066 | $54,561 | $10,332 | $44,229 |
| 2015 | $55,561 | $55,561 | $10,332 | $45,229 |
| 2014 | $2,043 | $54,110 | $10,609 | $43,501 |
| 2013 | -- | $52,534 | $10,300 | $42,234 |
Source: Public Records
Map
Nearby Homes
- 5805 Chimayo Dr NW
- 5901 Chimayo Dr NW
- 6133 Flor de Mayo Place NW
- 6101 Chimayo Dr NW
- 6005 Rio Pueblo Dr NW
- 5504 Hayes Dr NW
- 6304 Flor Del Sol Place NW
- 6020 Jamers Place NW
- 0 Unser Blvd NW
- 6420 Pojoaque Rd NW
- 6427 Pojoaque Dr NW
- 5609 Cambria Rd NW
- 0 Santo Domingo St NW Unit 1072927
- 5143 Gaviota NW
- 5129 Camino Vista NW
- 5432 Mariposa Dr NW
- 6116 Agate Ave NW
- 6705 Lamar Ave NW
- 6615 Astair Ave NW Unit 1
- 6616 Meadow Lake Place NW
- 6125 Buenos Aires Place NW
- 6117 Buenos Aires Place NW
- 6128 Cuesta Place NW
- 6124 Cuesta Place NW
- 6132 Cuesta Place NW
- 6120 Cuesta Place NW
- 6129 Buenos Aires Place NW
- 6113 Buenos Aires Place NW
- 6136 Cuesta Place NW
- 6122 Buenos Aires Place NW
- 6118 Buenos Aires Place NW
- 6126 Buenos Aires Place NW
- 6114 Buenos Aires Place NW
- 6116 Cuesta Place NW
- 6109 Buenos Aires Place NW
- 6133 Buenos Aires Place NW
- 6130 Buenos Aires Place NW
- 6140 Cuesta Place NW
- 6112 Cuesta Place NW
- 6123 Cuesta Place NW