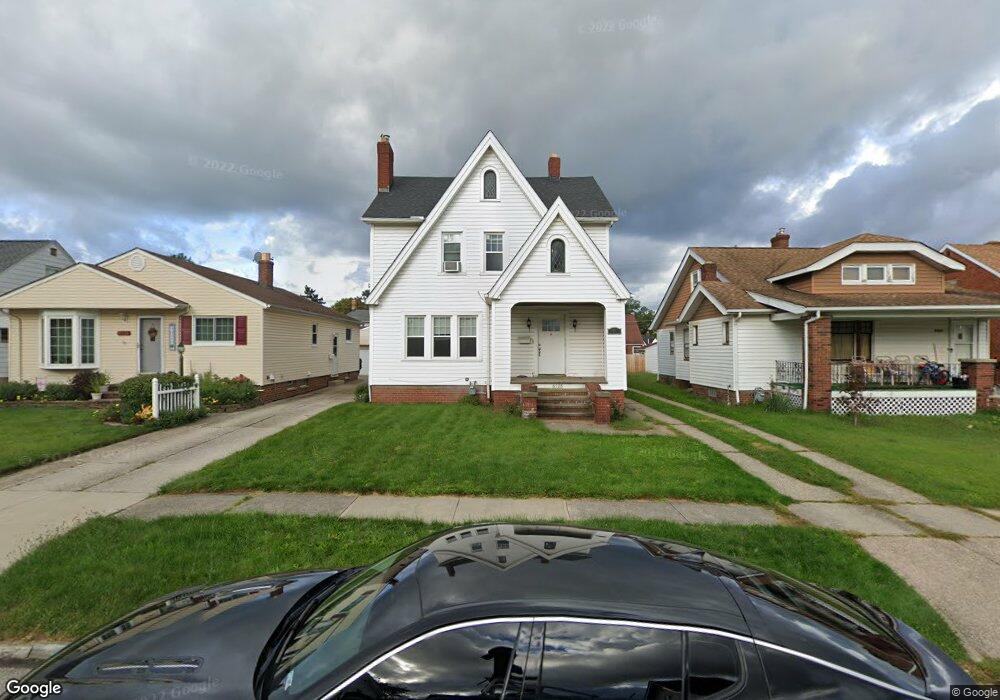
6126 Wareham Dr Cleveland, OH 44129
Estimated Value: $191,000 - $213,000
3
Beds
1
Bath
1,440
Sq Ft
$141/Sq Ft
Est. Value
About This Home
This home is located at 6126 Wareham Dr, Cleveland, OH 44129 and is currently estimated at $202,566, approximately $140 per square foot. 6126 Wareham Dr is a home located in Cuyahoga County with nearby schools including Renwood Elementary School, Thoreau Park Elementary School, and Shiloh Middle School.
Ownership History
Date
Name
Owned For
Owner Type
Purchase Details
Closed on
Nov 19, 2014
Sold by
Mrf Ohio One Llc and Sabatino Rosemarie A
Bought by
Andesite Residential Opportunity Fund Ll
Current Estimated Value
Purchase Details
Closed on
Jun 18, 2014
Sold by
Bartram Dana M
Bought by
Mrf Ohio One Llc
Purchase Details
Closed on
Oct 5, 2011
Sold by
Bartram Dana M and Bartram Eddie
Bought by
Bac Home Loans Servicing Lp
Purchase Details
Closed on
Dec 22, 2004
Sold by
Tischler June L
Bought by
Bartram Dana and Bartram Eddie
Home Financials for this Owner
Home Financials are based on the most recent Mortgage that was taken out on this home.
Original Mortgage
$121,000
Interest Rate
8.49%
Mortgage Type
Purchase Money Mortgage
Purchase Details
Closed on
Oct 23, 1978
Sold by
Kay John H and Kay Robert W
Bought by
Kay Robert W
Purchase Details
Closed on
Jan 1, 1975
Bought by
Kay John H and Kay Robert W
Create a Home Valuation Report for This Property
The Home Valuation Report is an in-depth analysis detailing your home's value as well as a comparison with similar homes in the area
Home Values in the Area
Average Home Value in this Area
Purchase History
| Date | Buyer | Sale Price | Title Company |
|---|---|---|---|
| Andesite Residential Opportunity Fund Ll | $49,677 | Ohio Real Title | |
| Mrf Ohio One Llc | $35,000 | None Available | |
| Bac Home Loans Servicing Lp | $46,000 | None Available | |
| Bartram Dana | $121,000 | Midland Title Agency | |
| Kay Robert W | -- | -- | |
| Kay John H | -- | -- |
Source: Public Records
Mortgage History
| Date | Status | Borrower | Loan Amount |
|---|---|---|---|
| Previous Owner | Bartram Dana | $121,000 |
Source: Public Records
Tax History Compared to Growth
Tax History
| Year | Tax Paid | Tax Assessment Tax Assessment Total Assessment is a certain percentage of the fair market value that is determined by local assessors to be the total taxable value of land and additions on the property. | Land | Improvement |
|---|---|---|---|---|
| 2024 | $3,583 | $57,645 | $10,500 | $47,145 |
| 2023 | $3,040 | $41,760 | $9,280 | $32,480 |
| 2022 | $3,011 | $41,760 | $9,280 | $32,480 |
| 2021 | $3,100 | $41,760 | $9,280 | $32,480 |
| 2020 | $2,715 | $32,130 | $7,140 | $24,990 |
| 2019 | $2,600 | $91,800 | $20,400 | $71,400 |
| 2018 | $2,616 | $32,130 | $7,140 | $24,990 |
| 2017 | $2,457 | $28,070 | $5,320 | $22,750 |
| 2016 | $2,442 | $28,070 | $5,320 | $22,750 |
| 2015 | -- | $28,070 | $5,320 | $22,750 |
| 2014 | -- | $28,640 | $5,430 | $23,210 |
Source: Public Records
Map
Nearby Homes
- 6096 Wareham Dr
- 6111 Manchester Rd
- 6610 Renwood Dr
- 6168 Manchester Rd
- 6701 Pelham Dr
- 6708 Thornton Dr
- 6136 Ridge Rd
- 7014 Thornton Dr
- 7503 Whittington Dr
- 6227 Ridge Rd
- 6234 N Canterbury Rd
- 7115 Hampstead Ave
- 6818 Hampstead Ave
- 6510 Belmere Dr
- 6298 Chestnut Hills Dr
- 6704 Charles Ave
- 7514 Spring Garden Rd
- 5603 Allanwood Dr
- 5415 Pelham Dr
- 7615 Bertha Ave
- 6120 Wareham Dr
- 6134 Wareham Dr
- 6142 Wareham Dr
- 6129 Manchester Rd
- 6146 Wareham Dr
- 6112 Wareham Dr
- 6121 Manchester Rd
- 6137 Manchester Rd
- 6115 Manchester Rd
- 6145 Manchester Rd
- 6108 Wareham Dr
- 6150 Wareham Dr
- 6127 Wareham Dr
- 6137 Wareham Dr
- 6149 Manchester Rd
- 6117 Wareham Dr
- 6104 Wareham Dr
- 6156 Wareham Dr
- 6113 Wareham Dr
- 6147 Wareham Dr