Estimated Value: $53,765 - $124,000
--
Bed
1
Bath
1,488
Sq Ft
$60/Sq Ft
Est. Value
About This Home
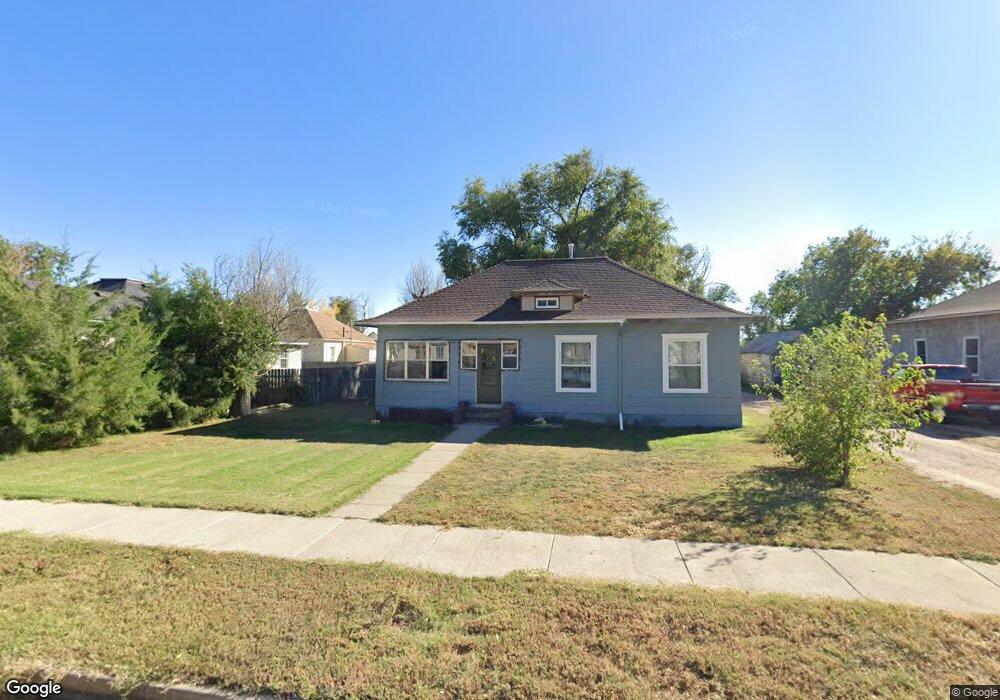
This home is located at 613 W Cheyenne St, Holly, CO 81047 and is currently estimated at $88,691, approximately $59 per square foot. 613 W Cheyenne St is a home with nearby schools including Shanner Elementary School, Holly High School, and Holly Junior High School.
Ownership History
Date
Name
Owned For
Owner Type
Purchase Details
Closed on
Sep 17, 2014
Sold by
Vargas Stanley R
Bought by
Chaparro Adan and Chaparro Amelia
Current Estimated Value
Home Financials for this Owner
Home Financials are based on the most recent Mortgage that was taken out on this home.
Original Mortgage
$7,500
Outstanding Balance
$5,750
Interest Rate
4.18%
Mortgage Type
New Conventional
Estimated Equity
$82,941
Purchase Details
Closed on
Sep 12, 2014
Sold by
Nelson Virginia
Bought by
Chaparro Adan and Chaparro Amelia
Home Financials for this Owner
Home Financials are based on the most recent Mortgage that was taken out on this home.
Original Mortgage
$7,500
Outstanding Balance
$5,750
Interest Rate
4.18%
Mortgage Type
New Conventional
Estimated Equity
$82,941
Purchase Details
Closed on
Oct 9, 2012
Sold by
Vargas Toni and Nelson Virginia
Bought by
Vargas Stanley R and Nelson Virginia
Purchase Details
Closed on
Sep 28, 2001
Sold by
Reece Alice
Bought by
Vargas Toni and Vargas Pillip
Create a Home Valuation Report for This Property
The Home Valuation Report is an in-depth analysis detailing your home's value as well as a comparison with similar homes in the area
Home Values in the Area
Average Home Value in this Area
Purchase History
| Date | Buyer | Sale Price | Title Company |
|---|---|---|---|
| Chaparro Adan | $5,000 | None Available | |
| Chaparro Adan | $5,000 | None Available | |
| Vargas Stanley R | -- | None Available | |
| Vargas Toni | $22,000 | -- |
Source: Public Records
Mortgage History
| Date | Status | Borrower | Loan Amount |
|---|---|---|---|
| Open | Chaparro Adan | $7,500 |
Source: Public Records
Tax History Compared to Growth
Tax History
| Year | Tax Paid | Tax Assessment Tax Assessment Total Assessment is a certain percentage of the fair market value that is determined by local assessors to be the total taxable value of land and additions on the property. | Land | Improvement |
|---|---|---|---|---|
| 2024 | $90 | $0 | $0 | $0 |
| 2023 | $90 | $5,684 | $1,417 | $4,267 |
| 2022 | $83 | $5,684 | $1,417 | $4,267 |
| 2021 | $95 | $905 | $226 | $679 |
| 2020 | $98 | $932 | $226 | $706 |
| 2019 | $99 | $837 | $203 | $634 |
| 2018 | $78 | $725 | $204 | $521 |
| 2017 | $77 | $725 | $204 | $521 |
| 2016 | $80 | $739 | $226 | $513 |
| 2015 | $79 | $739 | $226 | $513 |
| 2014 | $77 | $716 | $226 | $490 |
Source: Public Records
Map
Nearby Homes
- 200 S Main St
- 409 W Vinson St
- 700 W Cliff St
- 000 Road 35
- 208 S 6th St
- 113 N 8th St
- 37001-37035 County Road Ll
- 37001-37035 County Road Ll
- 0 Tbd County Road 8
- 406 E Amache Rd
- 410 S Main St
- TBD County Road 8
- 703 W Broderick Ave
- TBD County Road 27
- 8400 U S 50
- 8400 Highway 50
- 0 Tbd Road G Unit 11458884
- 0 Tbd Road G Unit 23036958
- 0 Tbd Road G Unit 11458882
- County Road 27
- 615 W Cheyenne St
- 605 W Cheyenne St
- 609 W Cheyenne St
- 610 W Cheyenne St
- 126 S 6th St
- 614 W Cheyenne St
- 618 W Cheyenne St
- 120 S 6th St
- 517 W Cheyenne St
- 118 S 6th St
- 215 S 6th St & Santa Fe St S
- 513 W Cheyenne St
- 637 W Cheyenne St
- 211 S 6th St
- 743 W Cheyenne St
- 720 W Cheyenne St
- 747 W Cheyenne St
- 601 W Colorado St
- 727 W Colorado St
- 744 W Cheyenne St