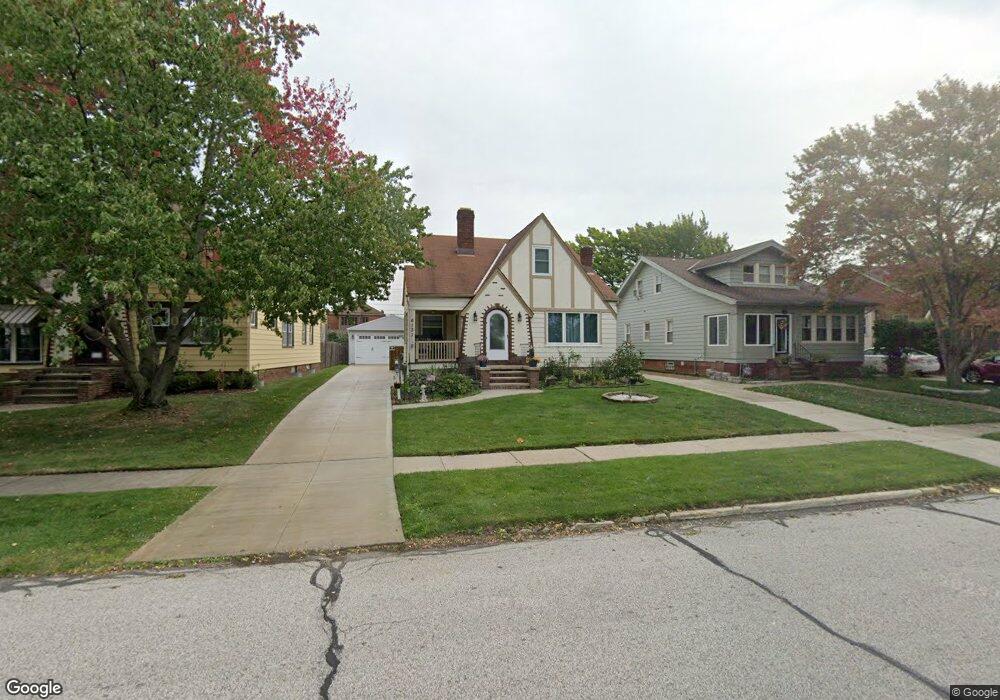
6131 Stanbury Rd Cleveland, OH 44129
Estimated Value: $202,668 - $265,000
4
Beds
1
Bath
1,293
Sq Ft
$174/Sq Ft
Est. Value
About This Home
This home is located at 6131 Stanbury Rd, Cleveland, OH 44129 and is currently estimated at $225,417, approximately $174 per square foot. 6131 Stanbury Rd is a home located in Cuyahoga County with nearby schools including Renwood Elementary School, Thoreau Park Elementary School, and Greenbriar Middle School.
Ownership History
Date
Name
Owned For
Owner Type
Purchase Details
Closed on
Mar 21, 2006
Sold by
Funk Cindy M and Funk Mark J
Bought by
Hooley Heather A
Current Estimated Value
Home Financials for this Owner
Home Financials are based on the most recent Mortgage that was taken out on this home.
Original Mortgage
$111,500
Outstanding Balance
$63,757
Interest Rate
6.37%
Mortgage Type
Purchase Money Mortgage
Estimated Equity
$161,660
Purchase Details
Closed on
Oct 22, 1999
Sold by
Sands Daniel
Bought by
Semuniuk Cindy M and Funk Mark J
Home Financials for this Owner
Home Financials are based on the most recent Mortgage that was taken out on this home.
Original Mortgage
$94,749
Interest Rate
7.78%
Mortgage Type
FHA
Purchase Details
Closed on
Nov 12, 1992
Sold by
Sands Mary Joan
Bought by
Sands Daniel
Purchase Details
Closed on
Jan 1, 1975
Bought by
Sands Mary Joan
Create a Home Valuation Report for This Property
The Home Valuation Report is an in-depth analysis detailing your home's value as well as a comparison with similar homes in the area
Home Values in the Area
Average Home Value in this Area
Purchase History
| Date | Buyer | Sale Price | Title Company |
|---|---|---|---|
| Hooley Heather A | $131,500 | Title Access Llc | |
| Semuniuk Cindy M | $92,000 | Quality Title Agency Inc | |
| Sands Daniel | -- | -- | |
| Sands Mary Joan | -- | -- |
Source: Public Records
Mortgage History
| Date | Status | Borrower | Loan Amount |
|---|---|---|---|
| Open | Hooley Heather A | $111,500 | |
| Previous Owner | Semuniuk Cindy M | $94,749 |
Source: Public Records
Tax History Compared to Growth
Tax History
| Year | Tax Paid | Tax Assessment Tax Assessment Total Assessment is a certain percentage of the fair market value that is determined by local assessors to be the total taxable value of land and additions on the property. | Land | Improvement |
|---|---|---|---|---|
| 2024 | $3,657 | $58,625 | $11,585 | $47,040 |
| 2023 | $3,630 | $50,550 | $10,260 | $40,290 |
| 2022 | $3,596 | $50,540 | $10,260 | $40,290 |
| 2021 | $3,705 | $50,540 | $10,260 | $40,290 |
| 2020 | $3,237 | $38,850 | $7,880 | $30,980 |
| 2019 | $3,107 | $111,000 | $22,500 | $88,500 |
| 2018 | $3,013 | $38,850 | $7,880 | $30,980 |
| 2017 | $3,065 | $35,600 | $6,790 | $28,810 |
| 2016 | $3,046 | $35,600 | $6,790 | $28,810 |
| 2015 | $2,945 | $35,600 | $6,790 | $28,810 |
| 2014 | $2,945 | $36,330 | $6,930 | $29,400 |
Source: Public Records
Map
Nearby Homes
- 6136 Ridge Rd
- 6168 Manchester Rd
- 6227 Ridge Rd
- 7503 Whittington Dr
- 6234 N Canterbury Rd
- 6111 Manchester Rd
- 6096 Wareham Dr
- 6298 Chestnut Hills Dr
- 8017 Wainstead Dr
- 6701 Pelham Dr
- 7014 Thornton Dr
- 6610 Renwood Dr
- 8017 Ackley Rd
- 6708 Thornton Dr
- 7115 Hampstead Ave
- 7514 Spring Garden Rd
- 6510 Belmere Dr
- 8514 Deerfield Dr
- 6818 Hampstead Ave
- 7615 Bertha Ave
- 6127 Stanbury Rd
- 6137 Stanbury Rd
- 6119 Stanbury Rd
- 6145 Stanbury Rd
- 6115 Stanbury Rd
- 6149 Stanbury Rd
- 6132 6140 Ridge Rd
- 6128 Ridge Rd
- 6146 Ridge Rd
- 6111 Stanbury Rd
- 6118 Ridge Rd
- 6157 Stanbury Rd
- 6150 Ridge Rd
- 6150 Ridge Rd Unit 1
- 6150 Ridge Rd Unit 2
- 6150 Ridge Rd Unit 3
- 6114 Ridge Rd
- 6107 Stanbury Rd
- 6148 Stanbury Rd
- 6161 Stanbury Rd