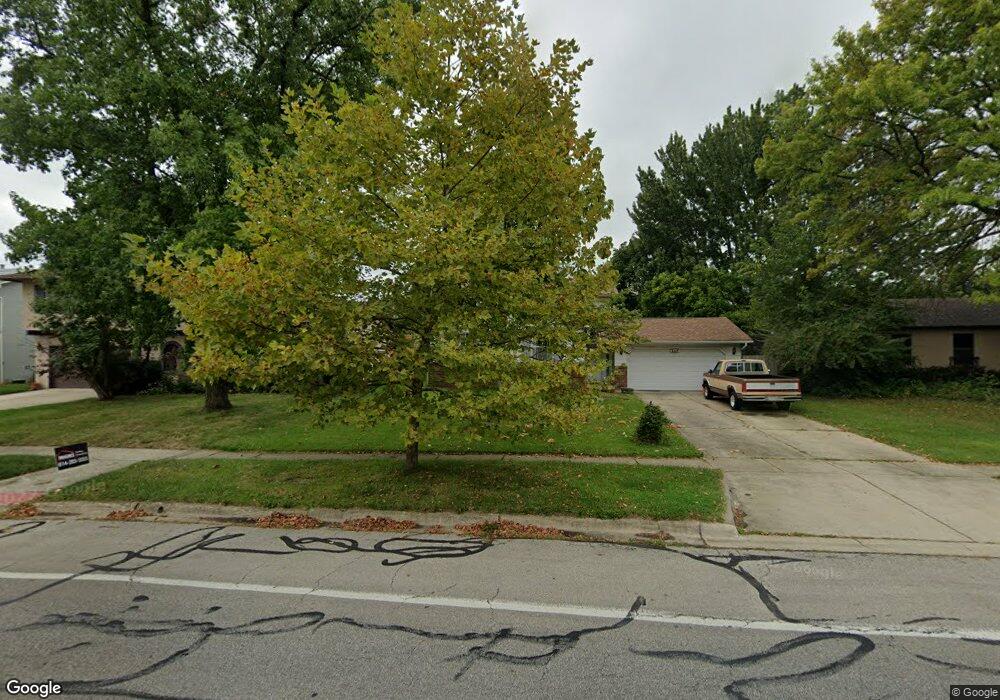
6149 Sharon Woods Blvd Columbus, OH 43229
Northgate NeighborhoodEstimated Value: $308,000 - $320,000
4
Beds
3
Baths
2,040
Sq Ft
$153/Sq Ft
Est. Value
About This Home
This home is located at 6149 Sharon Woods Blvd, Columbus, OH 43229 and is currently estimated at $312,862, approximately $153 per square foot. 6149 Sharon Woods Blvd is a home located in Franklin County with nearby schools including Alpine Elementary School, Northgate Intermediate, and Woodward Park Middle School.
Ownership History
Date
Name
Owned For
Owner Type
Purchase Details
Closed on
Oct 14, 2005
Sold by
Donaldson Bart
Bought by
Gingras Michael and Gingras Tamara
Current Estimated Value
Home Financials for this Owner
Home Financials are based on the most recent Mortgage that was taken out on this home.
Original Mortgage
$145,000
Outstanding Balance
$77,904
Interest Rate
5.82%
Mortgage Type
Fannie Mae Freddie Mac
Estimated Equity
$234,958
Purchase Details
Closed on
Sep 18, 2000
Sold by
Jinkens William A and Jinkens Marjorie K
Bought by
Donaldson Bart
Home Financials for this Owner
Home Financials are based on the most recent Mortgage that was taken out on this home.
Original Mortgage
$121,220
Interest Rate
7.98%
Purchase Details
Closed on
Mar 2, 1993
Bought by
Jinkens William A
Purchase Details
Closed on
Aug 7, 1989
Create a Home Valuation Report for This Property
The Home Valuation Report is an in-depth analysis detailing your home's value as well as a comparison with similar homes in the area
Home Values in the Area
Average Home Value in this Area
Purchase History
| Date | Buyer | Sale Price | Title Company |
|---|---|---|---|
| Gingras Michael | $145,000 | -- | |
| Donaldson Bart | $127,600 | Chicago Title | |
| Jinkens William A | $98,900 | -- | |
| -- | -- | -- |
Source: Public Records
Mortgage History
| Date | Status | Borrower | Loan Amount |
|---|---|---|---|
| Open | Gingras Michael | $145,000 | |
| Closed | Donaldson Bart | $121,220 |
Source: Public Records
Tax History Compared to Growth
Tax History
| Year | Tax Paid | Tax Assessment Tax Assessment Total Assessment is a certain percentage of the fair market value that is determined by local assessors to be the total taxable value of land and additions on the property. | Land | Improvement |
|---|---|---|---|---|
| 2024 | $4,081 | $90,940 | $22,720 | $68,220 |
| 2023 | $4,029 | $90,930 | $22,715 | $68,215 |
| 2022 | $2,917 | $56,250 | $15,300 | $40,950 |
| 2021 | $2,923 | $56,250 | $15,300 | $40,950 |
| 2020 | $2,926 | $56,250 | $15,300 | $40,950 |
| 2019 | $2,706 | $44,600 | $12,220 | $32,380 |
| 2018 | $2,531 | $44,600 | $12,220 | $32,380 |
| 2017 | $2,704 | $44,600 | $12,220 | $32,380 |
| 2016 | $2,602 | $39,280 | $9,140 | $30,140 |
| 2015 | $2,362 | $39,280 | $9,140 | $30,140 |
| 2014 | $2,368 | $39,280 | $9,140 | $30,140 |
| 2013 | $1,298 | $43,645 | $10,150 | $33,495 |
Source: Public Records
Map
Nearby Homes
- 6342 Bellmeadow Dr
- 1549 Alpine Dr
- 6245 Sharon Woods Blvd
- 6019 Beechcroft Rd
- 6407 Skywae Dr
- 6035 Karl Rd
- 6355 Johnanne St
- 6407 Faircrest Rd
- 6458 Faircrest Rd
- 6496 Hearthstone Ave
- 1752 Pine Tree St S Unit H
- 1743 Pine Tree St N Unit A
- 1635 Tendril Ct
- 5732 Beechcroft Rd Unit B
- 2250 Webster Canyon Ct
- 6448 Sharon Woods Blvd Unit B
- 5990 Ambleside Dr
- 5726 Beechcroft Rd Unit J
- 1288 Oakfield Dr N
- 2197 Bayfield Dr
- 6145 Sharon Woods Blvd
- 6153 Sharon Woods Blvd
- 1779 Harrington Dr
- 6141 Sharon Woods Blvd
- 1787 Harrington Dr
- 6157 Sharon Woods Blvd
- 1773 Harrington Dr
- 1795 Harrington Dr
- 6135 Sharon Woods Blvd
- 6161 Sharon Woods Blvd
- 6148 Sharon Woods Blvd
- 1811 Fairhaven Rd
- 6160 Harrington Ct
- 1765 Harrington Dr
- 6128 Sharon Woods Blvd
- 1799 Harrington Dr
- 6152 Harrington Ct
- 6129 Sharon Woods Blvd
- 6165 Sharon Woods Blvd
- 1780 Harrington Dr