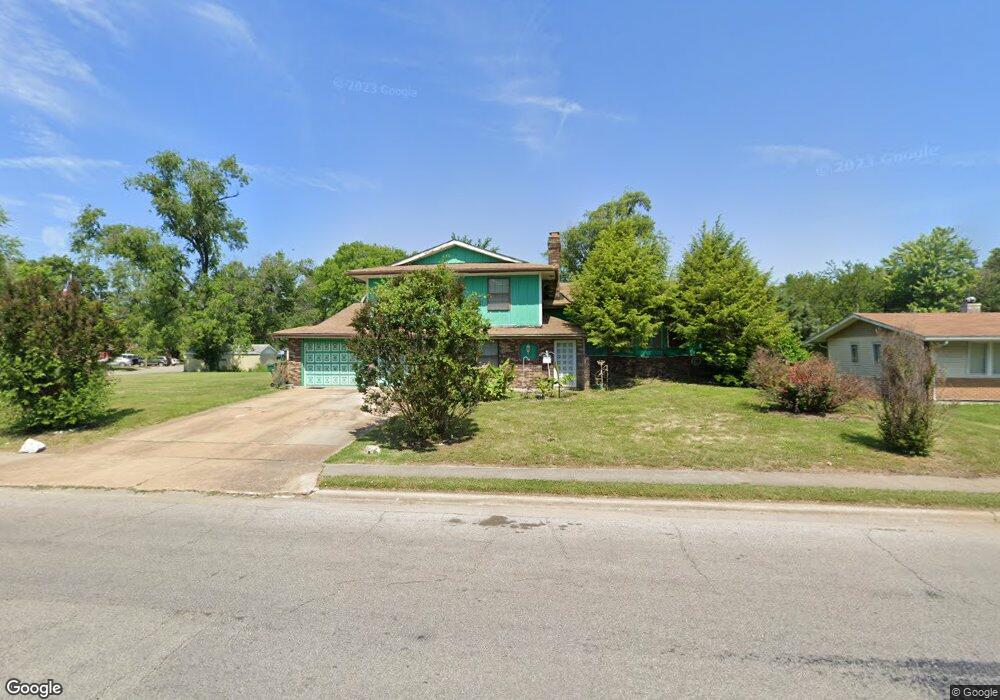
615 S 50th St East Saint Louis, IL 62207
Estimated Value: $56,000 - $100,000
--
Bed
--
Bath
908
Sq Ft
$83/Sq Ft
Est. Value
About This Home
This home is located at 615 S 50th St, East Saint Louis, IL 62207 and is currently estimated at $75,374, approximately $83 per square foot. 615 S 50th St is a home located in St. Clair County with nearby schools including Katie Harper-Wright Elementary School, Mason/Clark Middle School, and East St Louis Senior High School.
Ownership History
Date
Name
Owned For
Owner Type
Purchase Details
Closed on
Oct 4, 2024
Sold by
Corley Alexis
Bought by
Myers-Corley Donna and Corley Alexis N
Current Estimated Value
Purchase Details
Closed on
Oct 15, 2018
Sold by
Ward Joe and Ward Rhonda
Bought by
Corley Alexix N
Purchase Details
Closed on
Dec 29, 2017
Sold by
Ward Joe and Ward Rhonda
Bought by
Ward Joe and Ward Rhonda
Purchase Details
Closed on
Aug 24, 2012
Sold by
Fams Co Construction
Bought by
Corley Ciar A
Purchase Details
Closed on
Mar 20, 2009
Sold by
Myers Donna
Bought by
Ward Joe and Ward Rhonda
Purchase Details
Closed on
Mar 12, 2008
Sold by
Corley Andrew and Corley Marie
Bought by
Myers Donna
Create a Home Valuation Report for This Property
The Home Valuation Report is an in-depth analysis detailing your home's value as well as a comparison with similar homes in the area
Home Values in the Area
Average Home Value in this Area
Purchase History
| Date | Buyer | Sale Price | Title Company |
|---|---|---|---|
| Myers-Corley Donna | -- | None Available | |
| Corley Alexix N | -- | Attorney | |
| Ward Joe | -- | Attorney | |
| Corley Ciar A | -- | None Available | |
| Ward Joe | -- | None Available | |
| Myers Donna | $15,000 | None Available |
Source: Public Records
Tax History Compared to Growth
Tax History
| Year | Tax Paid | Tax Assessment Tax Assessment Total Assessment is a certain percentage of the fair market value that is determined by local assessors to be the total taxable value of land and additions on the property. | Land | Improvement |
|---|---|---|---|---|
| 2024 | $4,418 | $27,567 | $1,171 | $26,396 |
| 2023 | $3,110 | $24,916 | $1,058 | $23,858 |
| 2022 | $2,770 | $21,837 | $927 | $20,910 |
| 2021 | $2,704 | $20,692 | $878 | $19,814 |
| 2020 | $2,507 | $19,615 | $921 | $18,694 |
| 2019 | $3,731 | $19,615 | $921 | $18,694 |
| 2018 | $3,861 | $19,901 | $934 | $18,967 |
| 2017 | $3,281 | $19,420 | $911 | $18,509 |
| 2016 | $2,914 | $14,267 | $908 | $13,359 |
| 2014 | $1,288 | $14,112 | $898 | $13,214 |
| 2013 | $3,896 | $13,237 | $842 | $12,395 |
Source: Public Records
Map
Nearby Homes