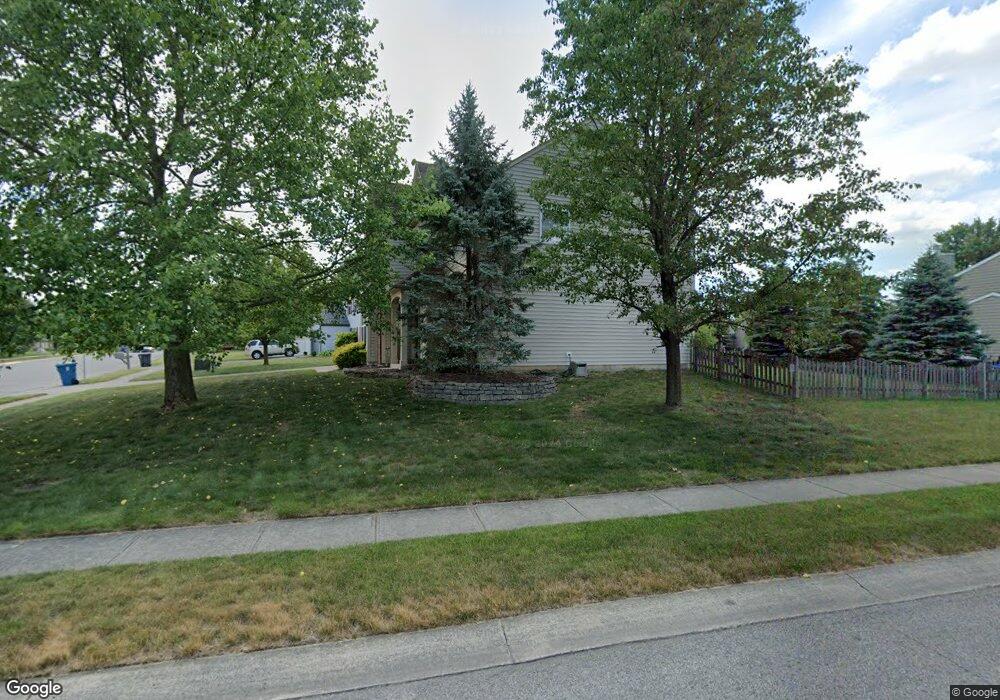
6150 Twyckenham Dr Indianapolis, IN 46236
Estimated Value: $325,000 - $367,000
4
Beds
3
Baths
2,314
Sq Ft
$148/Sq Ft
Est. Value
About This Home
This home is located at 6150 Twyckenham Dr, Indianapolis, IN 46236 and is currently estimated at $342,546, approximately $148 per square foot. 6150 Twyckenham Dr is a home located in Marion County with nearby schools including Sunnyside Elementary School, Fall Creek Valley Middle School, and Lawrence North High School.
Ownership History
Date
Name
Owned For
Owner Type
Purchase Details
Closed on
Mar 22, 2017
Sold by
Everrett Matthew B and Everrett Lacey E
Bought by
Everrett Matthew B and Everrett Lacey E
Current Estimated Value
Home Financials for this Owner
Home Financials are based on the most recent Mortgage that was taken out on this home.
Original Mortgage
$134,483
Outstanding Balance
$99,756
Interest Rate
4.25%
Mortgage Type
FHA
Estimated Equity
$242,790
Purchase Details
Closed on
Feb 18, 2010
Sold by
Hakeim Faye S and The Grsw Stewart Real Estate T
Bought by
Everett Matthew B and Everett Lacey E
Home Financials for this Owner
Home Financials are based on the most recent Mortgage that was taken out on this home.
Original Mortgage
$149,246
Interest Rate
5.5%
Mortgage Type
FHA
Purchase Details
Closed on
Dec 12, 2009
Sold by
Walker Michael T and Walker Maryann
Bought by
Grsw Stewart Real Estate Trust
Create a Home Valuation Report for This Property
The Home Valuation Report is an in-depth analysis detailing your home's value as well as a comparison with similar homes in the area
Home Values in the Area
Average Home Value in this Area
Purchase History
| Date | Buyer | Sale Price | Title Company |
|---|---|---|---|
| Everrett Matthew B | -- | -- | |
| Everett Matthew B | -- | None Available | |
| Grsw Stewart Real Estate Trust | -- | Stewart Title |
Source: Public Records
Mortgage History
| Date | Status | Borrower | Loan Amount |
|---|---|---|---|
| Open | Everrett Matthew B | $134,483 | |
| Previous Owner | Everett Matthew B | $149,246 |
Source: Public Records
Tax History Compared to Growth
Tax History
| Year | Tax Paid | Tax Assessment Tax Assessment Total Assessment is a certain percentage of the fair market value that is determined by local assessors to be the total taxable value of land and additions on the property. | Land | Improvement |
|---|---|---|---|---|
| 2024 | $3,126 | $290,100 | $40,700 | $249,400 |
| 2023 | $3,126 | $282,500 | $40,700 | $241,800 |
| 2022 | $2,903 | $258,500 | $40,700 | $217,800 |
| 2021 | $2,398 | $211,200 | $40,700 | $170,500 |
| 2020 | $2,263 | $197,600 | $32,000 | $165,600 |
| 2019 | $1,918 | $186,900 | $32,000 | $154,900 |
| 2018 | $1,739 | $169,200 | $32,000 | $137,200 |
| 2017 | $1,647 | $160,200 | $32,000 | $128,200 |
| 2016 | $1,575 | $153,200 | $32,000 | $121,200 |
| 2014 | $1,562 | $156,200 | $32,000 | $124,200 |
| 2013 | $1,635 | $163,500 | $32,000 | $131,500 |
Source: Public Records
Map
Nearby Homes
- 9914 Alexia Dr
- 6158 Welker Dr
- 10034 Twyckenham Ct
- 6137 Sandcherry Dr
- 6011 Twyckenham Dr
- 10249 Winlee Ct
- 6002 Draycott Dr
- 6415 Finch Dr
- 10020 Fountain Springs Ct
- 10475 Bartley Dr
- 10329 Liverpool Way
- 6485 Timber Leaf Ln
- 10612 Prestbury Dr
- 10570 Camille Ct
- 10629 Simsbury Ct
- 10339 Colville Ln
- 6631 Lee Rd
- 10218 Indian Lake Blvd S
- 10908 Tolliston Ln
- 10770 Indian Lake Blvd S
- 6142 Twyckenham Dr
- 9947 Redmond Ct
- 9941 Redmond Ct
- 9960 Redmond Ct
- 9952 Redmond Ct
- 9948 Alexia Dr
- 9962 Alexia Dr
- 9946 Redmond Ct
- 9938 Alexia Dr
- 9935 Redmond Ct
- 9932 Alexia Dr
- 9940 Redmond Ct
- 10006 Alexia Dr
- 9926 Alexia Dr
- 9934 Redmond Ct
- 9929 Redmond Ct
- 10014 Alexia Dr
- 9920 Alexia Dr
- 9961 Sharsted Ct
- 10020 Alexia Dr