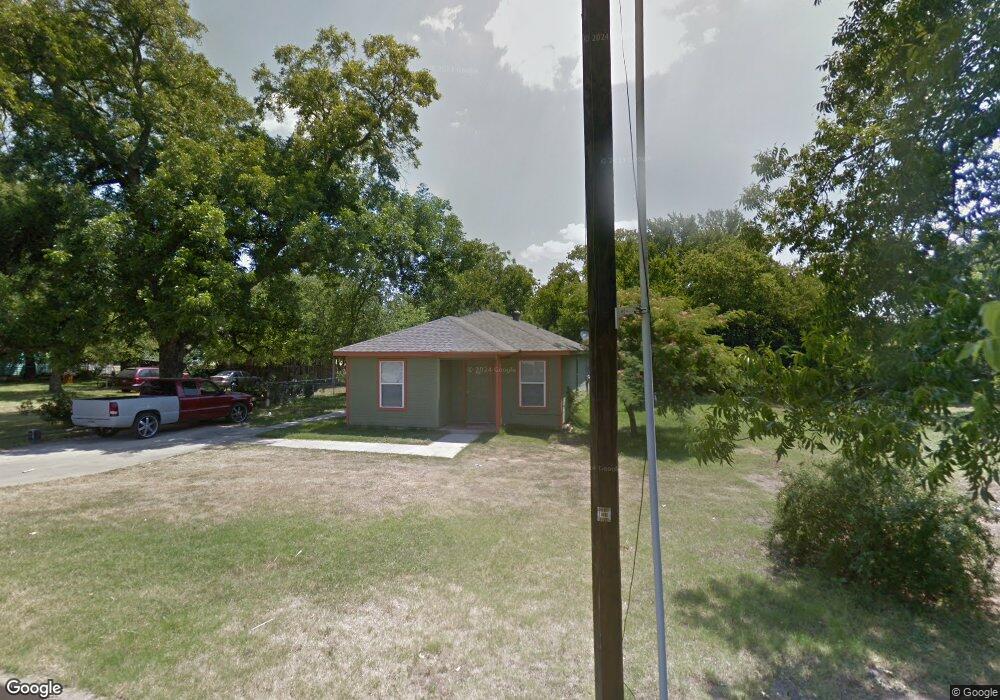
616 N Robinson St Cleburne, TX 76031
Estimated Value: $153,000 - $200,000
3
Beds
1
Bath
1,104
Sq Ft
$153/Sq Ft
Est. Value
About This Home
This home is located at 616 N Robinson St, Cleburne, TX 76031 and is currently estimated at $168,447, approximately $152 per square foot. 616 N Robinson St is a home located in Johnson County with nearby schools including Santa Fe Elementary School, Lowell Smith Jr. Middle School, and Cleburne High School.
Ownership History
Date
Name
Owned For
Owner Type
Purchase Details
Closed on
Sep 27, 2006
Sold by
City Of Cleburne
Bought by
Elysium Enterprises Lp
Current Estimated Value
Purchase Details
Closed on
Oct 13, 2005
Sold by
Anglin Street Partners Lp
Bought by
Elydum Enterprises Lp
Purchase Details
Closed on
Mar 15, 2005
Sold by
Bertrand Jeffery
Bought by
Anglin Street Partners Lp
Create a Home Valuation Report for This Property
The Home Valuation Report is an in-depth analysis detailing your home's value as well as a comparison with similar homes in the area
Home Values in the Area
Average Home Value in this Area
Purchase History
| Date | Buyer | Sale Price | Title Company |
|---|---|---|---|
| Elysium Enterprises Lp | -- | None Available | |
| Elydum Enterprises Lp | -- | Stnt | |
| Anglin Street Partners Lp | -- | None Available |
Source: Public Records
Tax History Compared to Growth
Tax History
| Year | Tax Paid | Tax Assessment Tax Assessment Total Assessment is a certain percentage of the fair market value that is determined by local assessors to be the total taxable value of land and additions on the property. | Land | Improvement |
|---|---|---|---|---|
| 2025 | $2,174 | $97,508 | $23,500 | $74,008 |
| 2024 | $2,174 | $97,508 | $23,500 | $74,008 |
| 2023 | $2,175 | $97,751 | $23,500 | $74,251 |
| 2022 | $2,446 | $97,751 | $23,500 | $74,251 |
| 2021 | $3,144 | $120,502 | $23,500 | $97,002 |
| 2020 | $2,506 | $90,428 | $20,000 | $70,428 |
| 2019 | $2,982 | $100,905 | $20,000 | $80,905 |
| 2018 | $1,918 | $64,882 | $8,500 | $56,382 |
| 2017 | $1,910 | $64,882 | $8,500 | $56,382 |
| 2016 | $1,910 | $64,882 | $8,500 | $56,382 |
| 2015 | $1,750 | $64,882 | $8,500 | $56,382 |
| 2014 | $1,750 | $65,664 | $6,500 | $59,164 |
Source: Public Records
Map
Nearby Homes
- 614 N Robinson St
- 612 N Robinson St
- 709 N Wilhite St Unit 711
- 603 N Anglin St
- 735 N Robinson St
- 741 N Robinson St
- 407 N Wilhite St
- 204 Robbins St
- 107 Mcarthur Ln
- 1308 N Brazos Ave
- 1300 N Brazos Ave
- 709 N Buffalo Ave
- 731 E Brown St
- 312 N Wood St
- 1014 Trinity St
- 105 E Lone Star Ave
- 507 N Buffalo Ave
- 922 N Buffalo Ave
- 605 Olive St
- 1033 Spring Azure Dr
- 613 N Wilhite St
- 611 N Wilhite St
- 622 N Robinson St
- 615 N Robinson St
- 619 N Robinson St
- 615 N Wilhite St
- 609 N Wilhite St
- 613 N Robinson St
- 621 N Robinson St
- 624 N Robinson St
- 611 N Robinson St
- 610 N Robinson St
- 609 N Robinson St
- 217 Ross St
- 608 N Robinson St
- 605 N Wilhite St
- 211 Mccoy St
- 210 Ross St
- 702 N Robinson St
- 210 May Ave