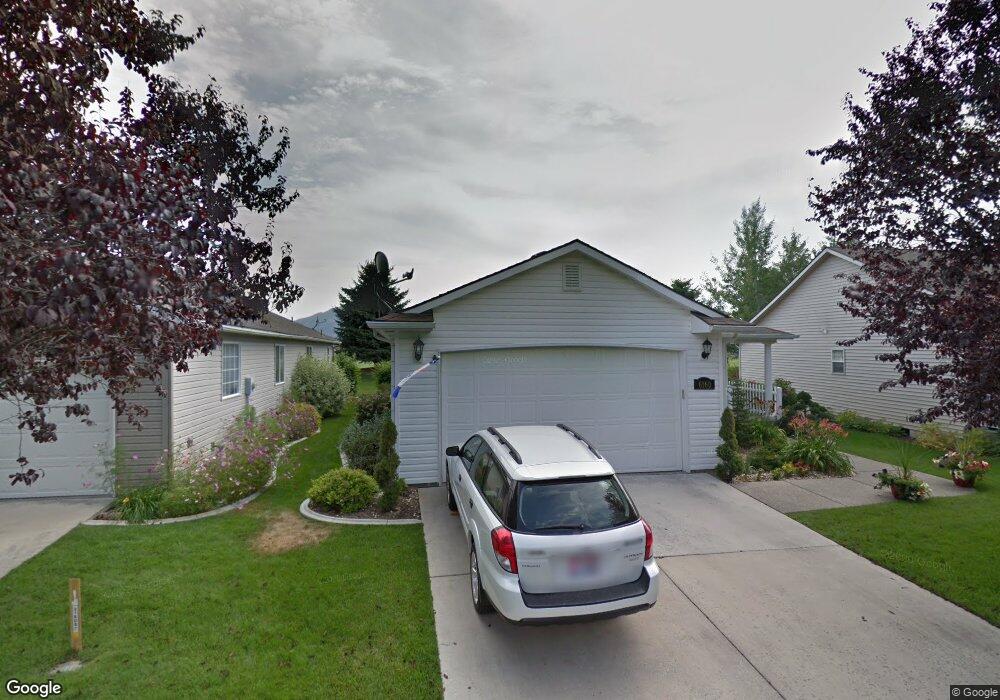
6160 N Harcourt Dr Coeur D Alene, ID 83815
Ramsey-Woodland NeighborhoodEstimated Value: $421,103 - $454,000
3
Beds
2
Baths
1,278
Sq Ft
$341/Sq Ft
Est. Value
About This Home
This home is located at 6160 N Harcourt Dr, Coeur D Alene, ID 83815 and is currently estimated at $435,276, approximately $340 per square foot. 6160 N Harcourt Dr is a home located in Kootenai County with nearby schools including Skyway Elementary School, Woodland Middle School, and Lake City High School.
Ownership History
Date
Name
Owned For
Owner Type
Purchase Details
Closed on
Feb 9, 2021
Sold by
Perry Delford and Perry Pamala
Bought by
Perry Delford and Perry Pamala
Current Estimated Value
Purchase Details
Closed on
Sep 21, 2011
Sold by
Perry Del and Perry Pamala
Bought by
Perry Delford and Perry Pamala
Home Financials for this Owner
Home Financials are based on the most recent Mortgage that was taken out on this home.
Original Mortgage
$256,500
Outstanding Balance
$174,808
Interest Rate
4.16%
Mortgage Type
Reverse Mortgage Home Equity Conversion Mortgage
Estimated Equity
$260,468
Purchase Details
Closed on
Aug 25, 2010
Sold by
Jordan Julie
Bought by
Perry Del and Perry Pamala
Home Financials for this Owner
Home Financials are based on the most recent Mortgage that was taken out on this home.
Original Mortgage
$27,000
Interest Rate
4.52%
Mortgage Type
New Conventional
Create a Home Valuation Report for This Property
The Home Valuation Report is an in-depth analysis detailing your home's value as well as a comparison with similar homes in the area
Home Values in the Area
Average Home Value in this Area
Purchase History
| Date | Buyer | Sale Price | Title Company |
|---|---|---|---|
| Perry Delford | -- | Accommodation | |
| Perry Delford | -- | -- | |
| Perry Del | -- | -- |
Source: Public Records
Mortgage History
| Date | Status | Borrower | Loan Amount |
|---|---|---|---|
| Open | Perry Delford | $256,500 | |
| Closed | Perry Del | $27,000 |
Source: Public Records
Tax History Compared to Growth
Tax History
| Year | Tax Paid | Tax Assessment Tax Assessment Total Assessment is a certain percentage of the fair market value that is determined by local assessors to be the total taxable value of land and additions on the property. | Land | Improvement |
|---|---|---|---|---|
| 2025 | $1,421 | $403,469 | $180,000 | $223,469 |
| 2024 | $1,421 | $403,734 | $180,000 | $223,734 |
| 2023 | $1,421 | $434,107 | $184,500 | $249,607 |
| 2022 | $1,913 | $480,209 | $205,000 | $275,209 |
| 2021 | $1,541 | $298,279 | $105,800 | $192,479 |
| 2020 | $1,485 | $262,703 | $92,000 | $170,703 |
| 2019 | $1,458 | $231,225 | $80,000 | $151,225 |
| 2018 | $1,379 | $210,398 | $72,765 | $137,633 |
| 2017 | $1,218 | $177,408 | $60,638 | $116,770 |
| 2016 | $1,219 | $168,320 | $57,750 | $110,570 |
| 2015 | $1,212 | $162,680 | $52,500 | $110,180 |
| 2013 | $1,119 | $136,450 | $37,800 | $98,650 |
Source: Public Records
Map
Nearby Homes
- 5887 N Harcourt Dr
- 2141 W Rousseau Dr
- 5969 N Belleville Dr
- 6058 N Madellaine Dr
- 2187 W Windermere Ave
- 2023 W Moselle Dr
- 6888 N Proust Dr
- 2122 W Windermere Ave
- 2214 W Windermere Ave
- 2154 W Windermere Ave
- 2551 W Renoir Dr
- 5824 N La Rochelle Dr
- 2189 W Yorkshire Ave
- 6522 N Idlewood Dr
- 2099 W Plymouth Cir
- 2297 W Plymouth Cir
- 6254 N Cornwall St
- 1815 W Dartmouth Cir
- 2922 W Marceille Dr
- 6961 N Verlaine Dr
- 6188 N Harcourt Dr
- 6146 N Harcourt Dr
- 6204 N Harcourt Dr
- 6222 N Harcourt Dr
- 2025 W Chappelle Ln
- 2025 W Chapelle Ln
- 6238 N Harcourt Dr
- 6131 N Harcourt Dr
- 6125 N Harcourt Dr
- 2039 W Chappelle Ln
- 2039 W Chapelle Ln
- 2012 W Normandie Ln
- 6107 N Harcourt Dr
- 6250 N Harcourt Dr
- 2020 W Normandie Ln
- 2047 W Chappelle Ln
- 2047 W Chapelle Ln
- 6276 N Harcourt Dr
- 2036 W Normandie Ln
- 2061 W Chappelle Ln