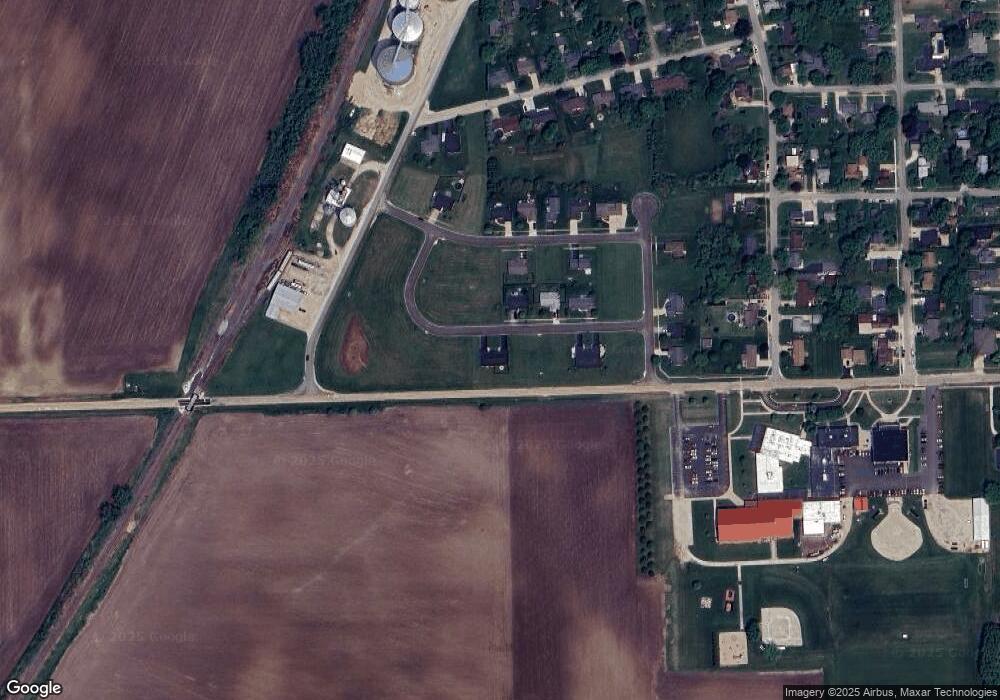
617 Effie Dr Unit 619 Earlville, IL 60518
Estimated Value: $258,000 - $352,000
4
Beds
4
Baths
2,290
Sq Ft
$129/Sq Ft
Est. Value
About This Home
This home is located at 617 Effie Dr Unit 619, Earlville, IL 60518 and is currently estimated at $295,797, approximately $129 per square foot. 617 Effie Dr Unit 619 is a home located in LaSalle County with nearby schools including Earlville Elementary School and Earlville Junior/Senior High School.
Ownership History
Date
Name
Owned For
Owner Type
Purchase Details
Closed on
Oct 11, 2011
Sold by
Fannie Mae
Bought by
Gavin Daniel L
Current Estimated Value
Purchase Details
Closed on
Nov 23, 2010
Sold by
Silagi John C
Bought by
Federal National Mortgagge Assn
Purchase Details
Closed on
Nov 30, 2006
Sold by
Silagi Carpentry Inc
Bought by
Silagi John C and Silagi Mary L
Purchase Details
Closed on
Aug 16, 2005
Sold by
Earlville Development Company Inc
Bought by
Silagi Carpentry Inc
Create a Home Valuation Report for This Property
The Home Valuation Report is an in-depth analysis detailing your home's value as well as a comparison with similar homes in the area
Home Values in the Area
Average Home Value in this Area
Purchase History
| Date | Buyer | Sale Price | Title Company |
|---|---|---|---|
| Gavin Daniel L | $110,500 | None Available | |
| Federal National Mortgagge Assn | -- | None Available | |
| Silagi John C | -- | None Available | |
| Silagi Carpentry Inc | $60,900 | None Available |
Source: Public Records
Mortgage History
| Date | Status | Borrower | Loan Amount |
|---|---|---|---|
| Closed | Silagi Carpentry Inc | $0 |
Source: Public Records
Tax History Compared to Growth
Tax History
| Year | Tax Paid | Tax Assessment Tax Assessment Total Assessment is a certain percentage of the fair market value that is determined by local assessors to be the total taxable value of land and additions on the property. | Land | Improvement |
|---|---|---|---|---|
| 2024 | $6,904 | $82,363 | $2,954 | $79,409 |
| 2023 | $6,324 | $72,752 | $2,609 | $70,143 |
| 2022 | $5,926 | $65,231 | $12,416 | $52,815 |
| 2021 | $6,051 | $64,116 | $12,204 | $51,912 |
| 2020 | $5,872 | $62,194 | $11,838 | $50,356 |
| 2019 | $5,757 | $59,504 | $11,326 | $48,178 |
| 2018 | $4,664 | $46,884 | $10,891 | $35,993 |
| 2017 | $4,644 | $45,840 | $13,665 | $32,175 |
| 2016 | $4,448 | $42,841 | $12,771 | $30,070 |
| 2015 | $4,504 | $42,995 | $12,236 | $30,759 |
| 2012 | -- | $32,972 | $14,376 | $18,596 |
Source: Public Records
Map
Nearby Homes
