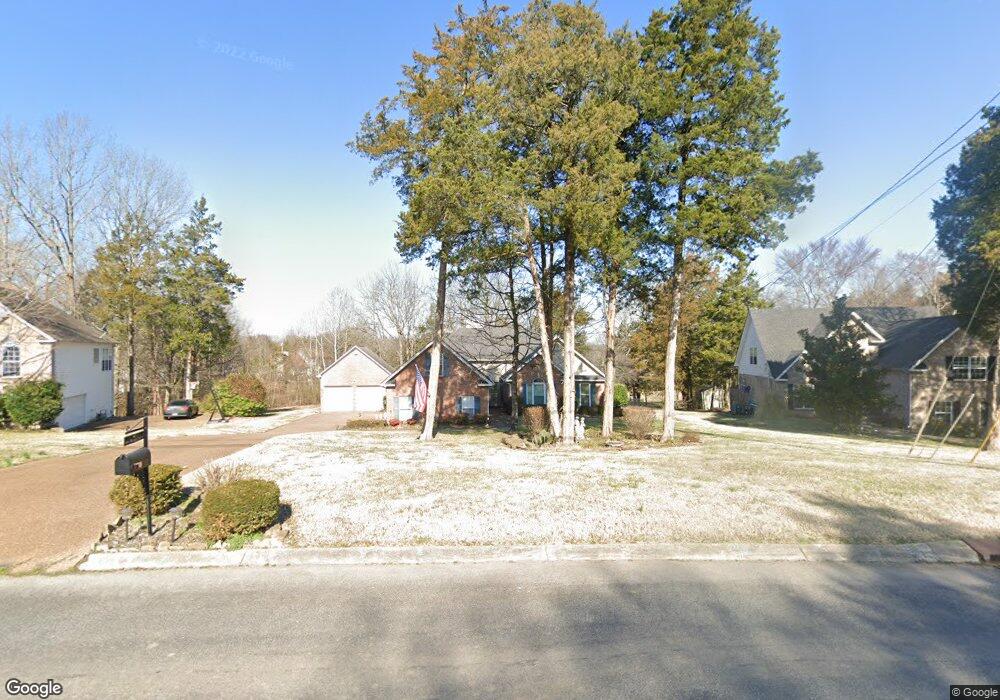
617 Mer Rouge Dr Nolensville, TN 37135
Estimated Value: $568,547 - $654,000
--
Bed
3
Baths
1,838
Sq Ft
$340/Sq Ft
Est. Value
About This Home
This home is located at 617 Mer Rouge Dr, Nolensville, TN 37135 and is currently estimated at $625,387, approximately $340 per square foot. 617 Mer Rouge Dr is a home located in Williamson County with nearby schools including Nolensville Elementary School, Mill Creek Middle School, and Nolensville High School.
Ownership History
Date
Name
Owned For
Owner Type
Purchase Details
Closed on
May 11, 2017
Sold by
Clark Roy H and Clark Letetia K
Bought by
Vest Robert C and Vest Nelda C
Current Estimated Value
Purchase Details
Closed on
Apr 20, 1998
Sold by
Great Southern Homes Inc
Bought by
Clark Roy H and Clark Letetia K
Home Financials for this Owner
Home Financials are based on the most recent Mortgage that was taken out on this home.
Original Mortgage
$143,120
Interest Rate
7.09%
Create a Home Valuation Report for This Property
The Home Valuation Report is an in-depth analysis detailing your home's value as well as a comparison with similar homes in the area
Home Values in the Area
Average Home Value in this Area
Purchase History
| Date | Buyer | Sale Price | Title Company |
|---|---|---|---|
| Vest Robert C | $367,500 | Southland Title & Escrow Co | |
| Clark Roy H | $178,900 | -- |
Source: Public Records
Mortgage History
| Date | Status | Borrower | Loan Amount |
|---|---|---|---|
| Previous Owner | Clark Roy H | $143,120 |
Source: Public Records
Tax History Compared to Growth
Tax History
| Year | Tax Paid | Tax Assessment Tax Assessment Total Assessment is a certain percentage of the fair market value that is determined by local assessors to be the total taxable value of land and additions on the property. | Land | Improvement |
|---|---|---|---|---|
| 2025 | $2,111 | $155,750 | $47,500 | $108,250 |
| 2024 | $2,111 | $97,300 | $21,250 | $76,050 |
| 2023 | $2,111 | $97,300 | $21,250 | $76,050 |
| 2022 | $2,111 | $97,300 | $21,250 | $76,050 |
| 2021 | $2,111 | $97,300 | $21,250 | $76,050 |
| 2020 | $1,992 | $79,375 | $16,250 | $63,125 |
| 2019 | $1,881 | $79,375 | $16,250 | $63,125 |
| 2018 | $1,826 | $79,375 | $16,250 | $63,125 |
| 2017 | $1,810 | $79,375 | $16,250 | $63,125 |
| 2016 | $1,786 | $79,375 | $16,250 | $63,125 |
| 2015 | -- | $60,925 | $12,500 | $48,425 |
| 2014 | -- | $60,925 | $12,500 | $48,425 |
Source: Public Records
Map
Nearby Homes
- 625 Mer Rouge Dr
- 1115 Oak Creek Dr
- 607 Quarter Horse Ln
- 825 Piccadilly Dr
- 1228 Countryside Rd
- 373 Baronswood Dr
- 2248 Rolling Hills Dr
- 0 Nolensville Rd Unit RTC2807764
- 0 Nolensville Rd Unit RTC2818506
- 0 Bostic Unit RTC2516475
- 0 Nolensville Rd Unit RTC3017763
- 720 Stonecastle Place
- 829 Stonebrook Blvd
- 2276 Rolling Hills Dr
- 3025 Ash Dale Ln
- 3051 Ash Dale Ln
- 3019 Ash Dale Ln
- 3027 Ash Dale Ln
- 904 Inglenook Ct
- 1016 Dortch Ln
- 615 Mer Rouge Dr
- 619 Mer Rouge Dr
- 613 Mer Rouge Dr
- 621 Mer Rouge Dr
- 614 Mer Rouge Dr
- 618 Mer Rouge Dr
- 1282 Countryside Rd
- 1278 Countryside Rd
- 611 Mer Rouge Dr
- 623 Mer Rouge Dr
- 1286 Countryside Rd
- 1274 Countryside Rd
- 212 Norfolk Ln
- 210 Norfolk Ln
- 610 Mer Rouge Dr
- 214 Norfolk Ln
- 208 Norfolk Ln
- 624 Mer Rouge Dr
- 609 Mer Rouge Dr
- 1290 Countryside Rd