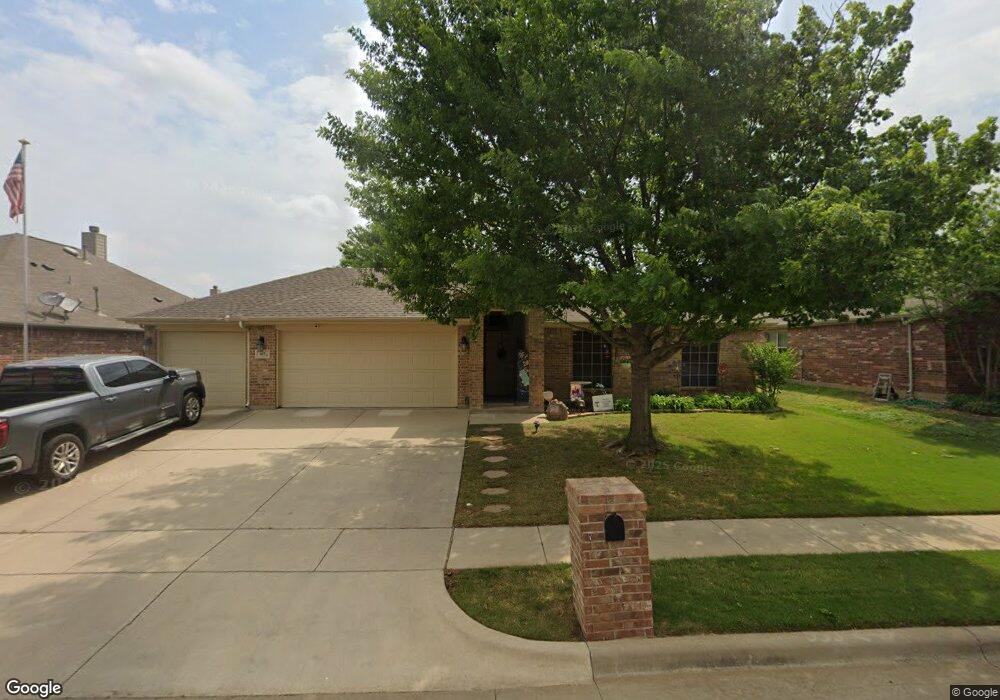
617 Swift Current Dr Crowley, TX 76036
Estimated Value: $309,350 - $322,000
4
Beds
2
Baths
2,082
Sq Ft
$152/Sq Ft
Est. Value
About This Home
This home is located at 617 Swift Current Dr, Crowley, TX 76036 and is currently estimated at $317,088, approximately $152 per square foot. 617 Swift Current Dr is a home located in Tarrant County with nearby schools including Bess Race Elementary School, Richard Allie Middle School, and Crowley High School.
Ownership History
Date
Name
Owned For
Owner Type
Purchase Details
Closed on
May 4, 2018
Sold by
D R Horton Texas Ltd
Bought by
Shabaz Banipal
Current Estimated Value
Home Financials for this Owner
Home Financials are based on the most recent Mortgage that was taken out on this home.
Original Mortgage
$158,792
Outstanding Balance
$136,882
Interest Rate
4.45%
Mortgage Type
New Conventional
Estimated Equity
$180,206
Purchase Details
Closed on
Jun 8, 2009
Sold by
Cheldan Mm Llc
Bought by
Nutt Janna G and Nutt Kenneth B
Home Financials for this Owner
Home Financials are based on the most recent Mortgage that was taken out on this home.
Original Mortgage
$144,837
Interest Rate
4.84%
Mortgage Type
FHA
Purchase Details
Closed on
Mar 16, 2009
Sold by
One Creekside Lp
Bought by
Cheldan Homes Lp
Create a Home Valuation Report for This Property
The Home Valuation Report is an in-depth analysis detailing your home's value as well as a comparison with similar homes in the area
Home Values in the Area
Average Home Value in this Area
Purchase History
| Date | Buyer | Sale Price | Title Company |
|---|---|---|---|
| Shabaz Banipal | -- | None Available | |
| Nutt Janna G | -- | Ltic | |
| Cheldan Homes Lp | -- | Stnt | |
| Cheldan Mm Llc | -- | None Available |
Source: Public Records
Mortgage History
| Date | Status | Borrower | Loan Amount |
|---|---|---|---|
| Open | Shabaz Banipal | $158,792 | |
| Previous Owner | Nutt Janna G | $144,837 |
Source: Public Records
Tax History Compared to Growth
Tax History
| Year | Tax Paid | Tax Assessment Tax Assessment Total Assessment is a certain percentage of the fair market value that is determined by local assessors to be the total taxable value of land and additions on the property. | Land | Improvement |
|---|---|---|---|---|
| 2025 | $4,928 | $272,000 | $60,000 | $212,000 |
| 2024 | $4,928 | $288,366 | $60,000 | $228,366 |
| 2023 | $6,405 | $334,954 | $45,000 | $289,954 |
| 2022 | $6,598 | $257,532 | $45,000 | $212,532 |
| 2021 | $6,361 | $239,385 | $45,000 | $194,385 |
| 2020 | $5,805 | $212,236 | $45,000 | $167,236 |
| 2019 | $5,527 | $213,001 | $45,000 | $168,001 |
| 2018 | $4,325 | $168,984 | $35,000 | $133,984 |
| 2017 | $5,096 | $168,984 | $35,000 | $133,984 |
| 2016 | $4,930 | $164,512 | $35,000 | $129,512 |
| 2015 | $3,948 | $148,600 | $30,000 | $118,600 |
| 2014 | $3,948 | $148,600 | $30,000 | $118,600 |
Source: Public Records
Map
Nearby Homes
- 608 S Heights Dr
- Harrison Plan at Tarrytown - Smart Series
- Eastland Plan at Tarrytown - Smart Series
- 1048 Tarryhill Dr
- Lavender Plan at Tarrytown - Cottage Series
- Zinnia Plan at Tarrytown - Cottage Series
- Dawson Plan at Tarrytown - Smart Series
- Marigold Plan at Tarrytown - Cottage Series
- Eucalyptus Plan at Tarrytown - Cottage Series
- Orchid Plan at Tarrytown - Cottage Series
- Violet Plan at Tarrytown - Cottage Series
- Camellia Plan at Tarrytown - Cottage Series
- Freestone Plan at Tarrytown - Smart Series
- Armstrong Plan at Tarrytown - Smart Series
- Hyacinth Plan at Tarrytown - Cottage Series
- 477 Bank Way
- Miyo Sensation Plan at Astoria Crossing - Clayton
- RM1676 Plan at Astoria Crossing - Clayton
- Colossal Plan at Astoria Crossing - Clayton
- Crazy Eights Plan at Astoria Crossing - Clayton
- 621 Swift Current Dr
- 613 Swift Current Dr
- 636 Handle Dr
- 609 Swift Current Dr
- 632 Handle Dr
- 625 Swift Current Dr
- 640 Handle Dr
- 628 Handle Dr
- 612 Swift Current Dr
- 616 Swift Current Dr
- 608 Swift Current Dr
- 629 Swift Current Dr
- 644 Handle Dr
- 624 Handle Dr
- 605 Swift Current Dr
- 604 Swift Current Dr
- 624 Swift Current Dr
- 648 Handle Dr
- 620 Handle Dr
- 633 Swift Current Dr