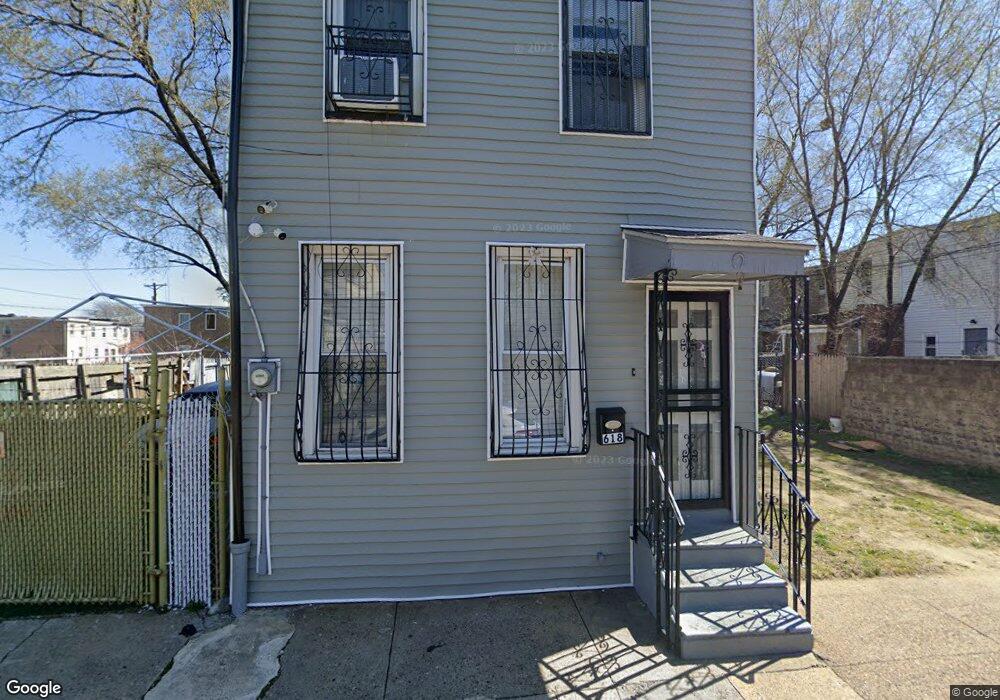
618 Saint John St Camden, NJ 08103
Lanning Square NeighborhoodEstimated Value: $101,389 - $196,000
--
Bed
--
Bath
1,120
Sq Ft
$131/Sq Ft
Est. Value
About This Home
This home is located at 618 Saint John St, Camden, NJ 08103 and is currently estimated at $146,847, approximately $131 per square foot. 618 Saint John St is a home located in Camden County with nearby schools including Camden High School, Hope Community Charter School, and Leap Academy University Charter School.
Ownership History
Date
Name
Owned For
Owner Type
Purchase Details
Closed on
Sep 9, 2014
Sold by
Gonzalez Norberto and Gonzalez Norberto
Bought by
Barnes Ramos Maria L
Current Estimated Value
Purchase Details
Closed on
Feb 27, 2004
Sold by
Ruberte Admilda
Bought by
Santiago Carmen
Home Financials for this Owner
Home Financials are based on the most recent Mortgage that was taken out on this home.
Original Mortgage
$31,500
Interest Rate
5.67%
Purchase Details
Closed on
Aug 20, 2002
Sold by
Stewart Mark
Bought by
Ruberte Admilda
Create a Home Valuation Report for This Property
The Home Valuation Report is an in-depth analysis detailing your home's value as well as a comparison with similar homes in the area
Home Values in the Area
Average Home Value in this Area
Purchase History
| Date | Buyer | Sale Price | Title Company |
|---|---|---|---|
| Barnes Ramos Maria L | -- | None Available | |
| Santiago Carmen | $35,099 | -- | |
| Ruberte Admilda | $15,000 | -- |
Source: Public Records
Mortgage History
| Date | Status | Borrower | Loan Amount |
|---|---|---|---|
| Previous Owner | Santiago Carmen | $31,500 |
Source: Public Records
Tax History Compared to Growth
Tax History
| Year | Tax Paid | Tax Assessment Tax Assessment Total Assessment is a certain percentage of the fair market value that is determined by local assessors to be the total taxable value of land and additions on the property. | Land | Improvement |
|---|---|---|---|---|
| 2025 | $1,729 | $48,800 | $6,300 | $42,500 |
| 2024 | $1,671 | $48,800 | $6,300 | $42,500 |
| 2023 | $1,671 | $48,800 | $6,300 | $42,500 |
| 2022 | $1,640 | $48,800 | $6,300 | $42,500 |
| 2021 | $1,634 | $48,800 | $6,300 | $42,500 |
| 2020 | $1,552 | $48,800 | $6,300 | $42,500 |
| 2019 | $1,486 | $48,800 | $6,300 | $42,500 |
| 2018 | $1,478 | $48,800 | $6,300 | $42,500 |
| 2017 | $1,442 | $48,800 | $6,300 | $42,500 |
| 2016 | $1,396 | $48,800 | $6,300 | $42,500 |
| 2015 | $1,344 | $48,800 | $6,300 | $42,500 |
| 2014 | $1,312 | $48,800 | $6,300 | $42,500 |
Source: Public Records
Map
Nearby Homes