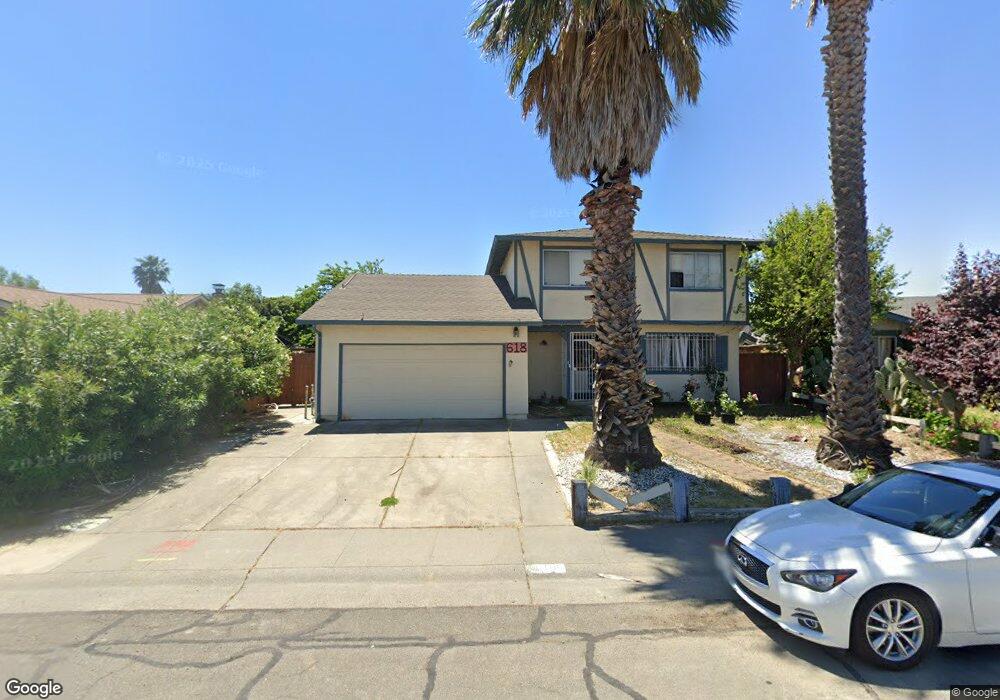
618 Wigeon Way Suisun City, CA 94585
Estimated Value: $529,000 - $569,000
4
Beds
3
Baths
1,904
Sq Ft
$290/Sq Ft
Est. Value
About This Home
This home is located at 618 Wigeon Way, Suisun City, CA 94585 and is currently estimated at $552,486, approximately $290 per square foot. 618 Wigeon Way is a home located in Solano County with nearby schools including Suisun Elementary School, Crystal Middle School, and Armijo High School.
Ownership History
Date
Name
Owned For
Owner Type
Purchase Details
Closed on
Jan 26, 2018
Sold by
French Verra and French Family Trusrt
Bought by
Jennings Carmen
Current Estimated Value
Home Financials for this Owner
Home Financials are based on the most recent Mortgage that was taken out on this home.
Original Mortgage
$375,250
Outstanding Balance
$317,323
Interest Rate
3.93%
Mortgage Type
New Conventional
Estimated Equity
$235,163
Purchase Details
Closed on
Sep 12, 2012
Sold by
Bohl Peter M
Bought by
French Verra and French Family Trust
Home Financials for this Owner
Home Financials are based on the most recent Mortgage that was taken out on this home.
Original Mortgage
$160,000
Interest Rate
3.55%
Mortgage Type
Seller Take Back
Purchase Details
Closed on
Sep 17, 1997
Sold by
Peter Bohl
Bought by
Bohl Peter M and Bohl Rosanna S L
Create a Home Valuation Report for This Property
The Home Valuation Report is an in-depth analysis detailing your home's value as well as a comparison with similar homes in the area
Home Values in the Area
Average Home Value in this Area
Purchase History
| Date | Buyer | Sale Price | Title Company |
|---|---|---|---|
| Jennings Carmen | $395,000 | Old Republic Title Co | |
| French Verra | $160,000 | Old Republic Title Company | |
| Bohl Peter M | -- | -- |
Source: Public Records
Mortgage History
| Date | Status | Borrower | Loan Amount |
|---|---|---|---|
| Open | Jennings Carmen | $375,250 | |
| Previous Owner | French Verra | $160,000 |
Source: Public Records
Tax History Compared to Growth
Tax History
| Year | Tax Paid | Tax Assessment Tax Assessment Total Assessment is a certain percentage of the fair market value that is determined by local assessors to be the total taxable value of land and additions on the property. | Land | Improvement |
|---|---|---|---|---|
| 2025 | $5,112 | $449,438 | $108,091 | $341,347 |
| 2024 | $5,112 | $440,626 | $105,972 | $334,654 |
| 2023 | $4,955 | $431,988 | $103,895 | $328,093 |
| 2022 | $4,893 | $423,518 | $101,858 | $321,660 |
| 2021 | $4,842 | $415,214 | $99,861 | $315,353 |
| 2020 | $4,730 | $410,958 | $98,838 | $312,120 |
| 2019 | $4,611 | $402,900 | $96,900 | $306,000 |
| 2018 | $2,997 | $243,505 | $43,289 | $200,216 |
| 2017 | $2,863 | $238,732 | $42,441 | $196,291 |
| 2016 | $2,839 | $234,052 | $41,609 | $192,443 |
| 2015 | $2,655 | $230,537 | $40,984 | $189,553 |
| 2014 | $2,637 | $226,022 | $40,182 | $185,840 |
Source: Public Records
Map
Nearby Homes
- 800 Spoonbill Ln
- 522 Honker Ln
- 953 Mccoy Creek Cir
- 540 Coot Ln
- 813 Redhead Way
- 518 Blue Wing Dr
- Berryessa Plan at Midway Meadows
- Adobe Plan at Midway Meadows
- Cordelia Plan at Midway Meadows
- 815 Golden Eye Way
- 508 Trumpeter Dr
- 414 Bauman Dr
- 829 Tree Duck Way
- 85 Coral Ln
- 906 Trumpeter Ct
- 907 Shelduck Ct
- 79 Chipman Ln
- 412 Craven Dr
- 1105 Strawberry Ln
- 1100 Camellia Ln
- 620 Wigeon Way
- 616 Wigeon Way
- 614 Wigeon Way
- 622 Wigeon Way
- 615 Wigeon Way
- 624 Wigeon Way
- 612 Wigeon Way
- 621 Wigeon Way
- 613 Wigeon Way
- 625 Wigeon Way
- 610 Wigeon Way
- 626 Wigeon Way
- 611 Wigeon Way
- 612 Ring Neck Ln
- 610 Ring Neck Ln
- 614 Ring Neck Ln
- 608 Ring Neck Ln
- 627 Wigeon Way
- 608 Wigeon Way
- 609 Wigeon Way