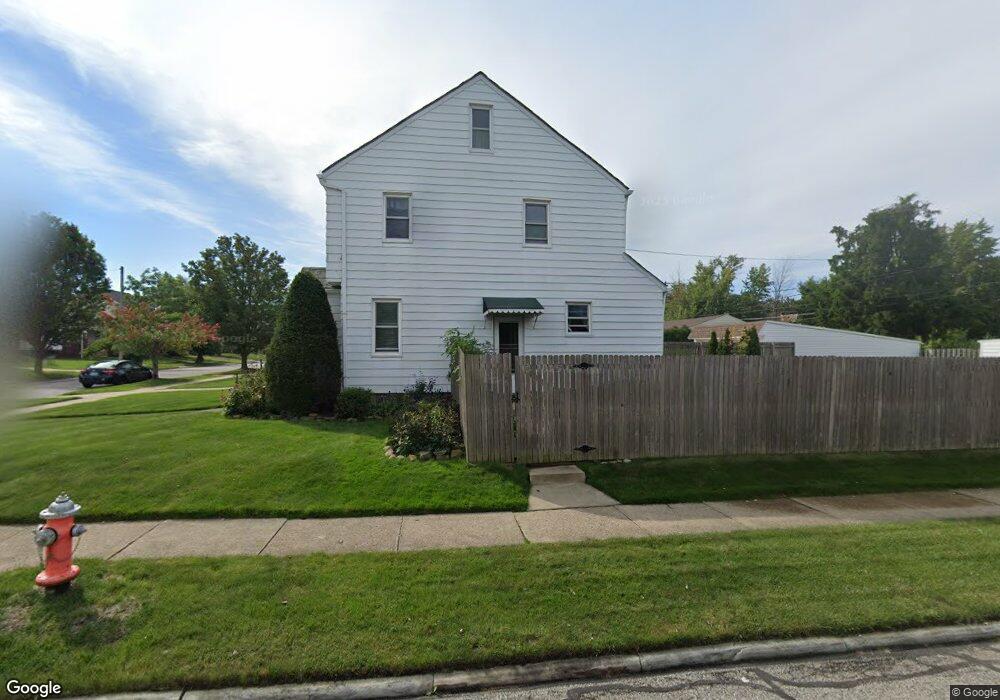
6184 Manchester Rd Cleveland, OH 44129
Estimated Value: $174,000 - $222,000
3
Beds
1
Bath
1,220
Sq Ft
$160/Sq Ft
Est. Value
About This Home
This home is located at 6184 Manchester Rd, Cleveland, OH 44129 and is currently estimated at $194,643, approximately $159 per square foot. 6184 Manchester Rd is a home located in Cuyahoga County with nearby schools including Renwood Elementary School, Thoreau Park Elementary School, and Parma High School.
Ownership History
Date
Name
Owned For
Owner Type
Purchase Details
Closed on
Nov 1, 2001
Sold by
Calkins Merna Lou
Bought by
Lecznar Gregory
Current Estimated Value
Home Financials for this Owner
Home Financials are based on the most recent Mortgage that was taken out on this home.
Original Mortgage
$82,650
Outstanding Balance
$32,494
Interest Rate
6.8%
Estimated Equity
$162,149
Purchase Details
Closed on
Oct 31, 2001
Sold by
Calkins John R
Bought by
Lecznar Gregory
Home Financials for this Owner
Home Financials are based on the most recent Mortgage that was taken out on this home.
Original Mortgage
$82,650
Outstanding Balance
$32,494
Interest Rate
6.8%
Estimated Equity
$162,149
Purchase Details
Closed on
Aug 13, 1993
Sold by
Calkins Norman and Calkins Annabel R
Bought by
Calkins Annabel
Purchase Details
Closed on
Jan 1, 1975
Bought by
Calkins Norman and Calkins Annabel R
Create a Home Valuation Report for This Property
The Home Valuation Report is an in-depth analysis detailing your home's value as well as a comparison with similar homes in the area
Home Values in the Area
Average Home Value in this Area
Purchase History
| Date | Buyer | Sale Price | Title Company |
|---|---|---|---|
| Lecznar Gregory | -- | Chicago Title | |
| Lecznar Gregory | -- | Chicago Title | |
| Lecznar Gregory | -- | Chicago Title | |
| Lecznar Gregory | $87,000 | Chicago Title | |
| Calkins Annabel | -- | -- | |
| Calkins Norman | -- | -- |
Source: Public Records
Mortgage History
| Date | Status | Borrower | Loan Amount |
|---|---|---|---|
| Open | Lecznar Gregory | $82,650 |
Source: Public Records
Tax History Compared to Growth
Tax History
| Year | Tax Paid | Tax Assessment Tax Assessment Total Assessment is a certain percentage of the fair market value that is determined by local assessors to be the total taxable value of land and additions on the property. | Land | Improvement |
|---|---|---|---|---|
| 2024 | $3,222 | $52,430 | $12,040 | $40,390 |
| 2023 | $2,866 | $40,010 | $10,640 | $29,370 |
| 2022 | $2,838 | $40,010 | $10,640 | $29,370 |
| 2021 | $2,919 | $40,010 | $10,640 | $29,370 |
| 2020 | $2,557 | $30,770 | $8,190 | $22,580 |
| 2019 | $2,446 | $87,900 | $23,400 | $64,500 |
| 2018 | $2,280 | $30,770 | $8,190 | $22,580 |
| 2017 | $2,261 | $26,220 | $6,060 | $20,160 |
| 2016 | $2,247 | $26,220 | $6,060 | $20,160 |
| 2015 | $2,133 | $26,220 | $6,060 | $20,160 |
| 2014 | $2,133 | $26,750 | $6,200 | $20,550 |
Source: Public Records
Map
Nearby Homes
- 6168 Manchester Rd
- 6227 Ridge Rd
- 6234 N Canterbury Rd
- 6136 Ridge Rd
- 6111 Manchester Rd
- 6096 Wareham Dr
- 6701 Pelham Dr
- 6298 Chestnut Hills Dr
- 6610 Renwood Dr
- 7503 Whittington Dr
- 6510 Belmere Dr
- 7014 Thornton Dr
- 6708 Thornton Dr
- 8017 Wainstead Dr
- 7115 Hampstead Ave
- 8017 Ackley Rd
- 6818 Hampstead Ave
- 6921 Hollywood Dr
- 7514 Spring Garden Rd
- 6430 Monmouth Dr
- 6190 Manchester Rd
- 6198 Manchester Rd
- 6202 Manchester Rd
- 6187 Ridge Rd
- 6164 Manchester Rd
- 6191 Ridge Rd
- 6201 Ridge Rd
- 6169 Ridge Rd
- 6206 Manchester Rd
- 6160 Manchester Rd
- 6185 Manchester Rd
- 6191 Manchester Rd
- 6205 Ridge Rd
- 6199 Manchester Rd
- 6163 Ridge Rd
- 6169 Manchester Rd
- 6201 Manchester Rd
- 6214 Manchester Rd
- 6154 Manchester Rd
- 6203 Ridge Rd