
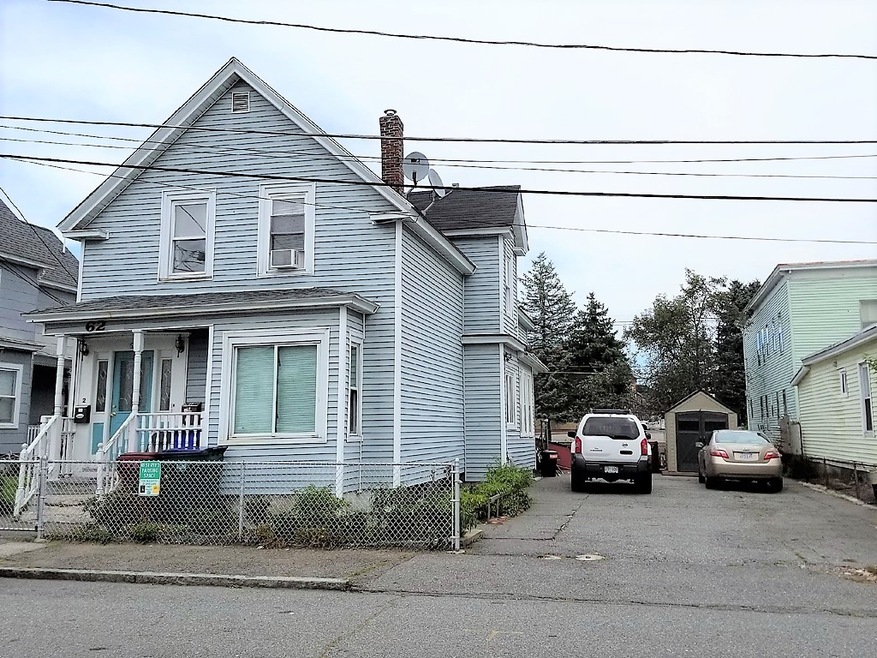
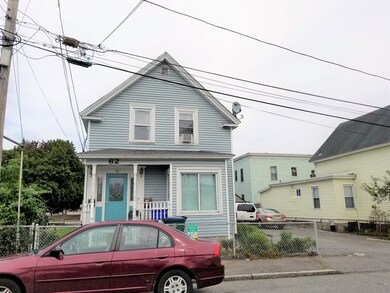
62 Cambridge St Lowell, MA 01851
Lower Highlands Neighborhood
6
Beds
2
Baths
1,912
Sq Ft
3,485
Sq Ft Lot
About This Home
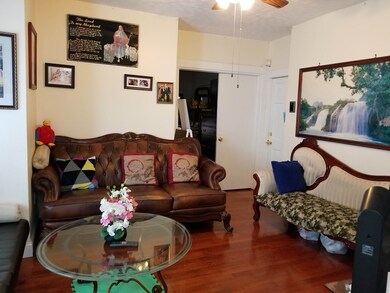
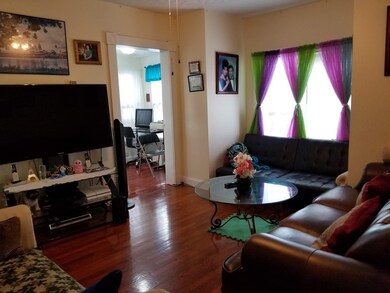
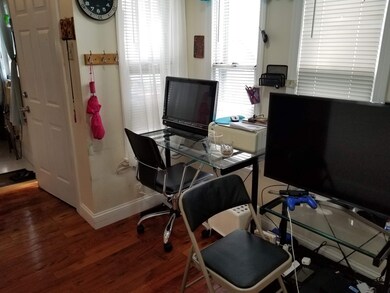
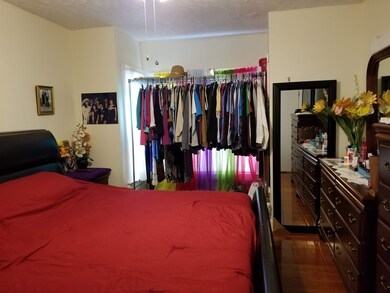
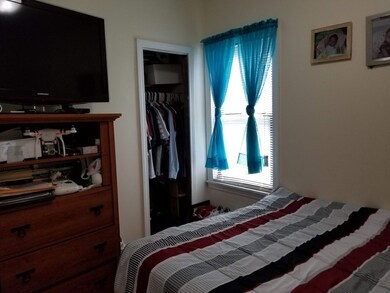
As of December 2018Very cozy two family home in the Highlands that is closed to everything: school, shops including Target, park, public transportation with easy access to highway. First floor has six rooms include 3 bedrooms, a living room, small office room, kitchen and a full bathroom. Second floor has a living room that is being used as a bedroom plus additional 2 bedrooms, kitchen, and a full bath. First floor is being heated by forced hot air by gas and second floor is being heated by gas radiator. It is well maintained and is fully occupied. The first floor can be vacant prior to closing. Second floor tenants would like to stay.
Property Details
Home Type
- Multi-Family
Est. Annual Taxes
- $5,582
Year Built
- Built in 1940
Flooring
- Wood
- Laminate
Outdoor Features
- Porch
Utilities
- Water Holding Tank
- Natural Gas Water Heater
Additional Features
- Basement
Listing and Financial Details
- Assessor Parcel Number M:143 B:990 L:62
Ownership History
Date
Name
Owned For
Owner Type
Purchase Details
Listed on
Sep 25, 2018
Closed on
Dec 21, 2018
Sold by
Ton Sary
Bought by
Pouv Vibol and Pouv Meyvannak
Seller's Agent
Paul-Ratha Yem
Global Realty Network, Inc.
Buyer's Agent
Borath Men
Homeplace Realty, Inc.
List Price
$384,900
Sold Price
$375,000
Premium/Discount to List
-$9,900
-2.57%
Current Estimated Value
Home Financials for this Owner
Home Financials are based on the most recent Mortgage that was taken out on this home.
Estimated Appreciation
$219,207
Avg. Annual Appreciation
6.97%
Original Mortgage
$368,207
Interest Rate
4.87%
Mortgage Type
FHA
Purchase Details
Closed on
Jun 29, 2017
Sold by
Ton John and Chhum Linda
Bought by
Ton Sary
Home Financials for this Owner
Home Financials are based on the most recent Mortgage that was taken out on this home.
Original Mortgage
$281,084
Interest Rate
4.02%
Mortgage Type
FHA
Purchase Details
Closed on
Mar 20, 2017
Sold by
Ton John and Ton Sary
Bought by
Ton John
Purchase Details
Listed on
Jun 7, 2015
Closed on
Sep 22, 2015
Sold by
Chhim Chheang H
Bought by
Ton John
Seller's Agent
Van Son
Mass Broker Services
Buyer's Agent
Doeun Uy
Citiwide Real Estate
List Price
$279,900
Sold Price
$270,000
Premium/Discount to List
-$9,900
-3.54%
Home Financials for this Owner
Home Financials are based on the most recent Mortgage that was taken out on this home.
Avg. Annual Appreciation
8.11%
Purchase Details
Listed on
Jun 7, 2015
Closed on
Aug 28, 2015
Sold by
Ton John
Bought by
Ton John and Ton Sary
Seller's Agent
Van Son
Mass Broker Services
Buyer's Agent
Doeun Uy
Citiwide Real Estate
List Price
$279,900
Sold Price
$270,000
Premium/Discount to List
-$9,900
-3.54%
Purchase Details
Listed on
Mar 24, 2013
Closed on
Sep 24, 2013
Sold by
Thon Sovannora
Bought by
Chhim Chheang H
Seller's Agent
Van Son
Mass Broker Services
Buyer's Agent
Van Son
Mass Broker Services
List Price
$110,000
Sold Price
$120,000
Premium/Discount to List
$10,000
9.09%
Home Financials for this Owner
Home Financials are based on the most recent Mortgage that was taken out on this home.
Avg. Annual Appreciation
52.22%
Purchase Details
Closed on
Mar 20, 2013
Sold by
Khath Rumchek and Thon Sovannora
Bought by
Thon Sovannora
Purchase Details
Closed on
Apr 5, 2011
Sold by
Khath Rumcheck
Bought by
Lowell City Of
Purchase Details
Closed on
Mar 1, 2004
Sold by
Lac Soleap and San Sokha
Bought by
Khath Rumchek and Thon Sovannora
Purchase Details
Closed on
Jul 27, 1993
Sold by
Meridian Mtg Corp
Bought by
Lac Soleap and San Sokha
Purchase Details
Closed on
Mar 1, 1993
Sold by
Kanel Christopher and Meridian Mtg Corp
Bought by
Fhlmc
Similar Homes in Lowell, MA
Create a Home Valuation Report for This Property
The Home Valuation Report is an in-depth analysis detailing your home's value as well as a comparison with similar homes in the area
Home Values in the Area
Average Home Value in this Area
Purchase History
| Date | Type | Sale Price | Title Company |
|---|---|---|---|
| Not Resolvable | $375,000 | -- | |
| Deed | $325,000 | -- | |
| Deed | $325,000 | -- | |
| Quit Claim Deed | -- | -- | |
| Quit Claim Deed | -- | -- | |
| Deed | -- | -- | |
| Quit Claim Deed | -- | -- | |
| Deed | -- | -- | |
| Quit Claim Deed | -- | -- | |
| Quit Claim Deed | -- | -- | |
| Quit Claim Deed | $270,000 | -- | |
| Not Resolvable | $120,000 | -- | |
| Deed | -- | -- | |
| Deed | -- | -- | |
| Deed | $302 | -- | |
| Deed | $302 | -- | |
| Deed | $283,000 | -- | |
| Deed | $283,000 | -- | |
| Deed | $25,000 | -- | |
| Deed | $25,000 | -- | |
| Foreclosure Deed | $58,000 | -- | |
| Foreclosure Deed | $58,000 | -- |
Source: Public Records
Mortgage History
| Date | Status | Loan Amount | Loan Type |
|---|---|---|---|
| Open | $371,591 | FHA | |
| Closed | $368,206 | FHA | |
| Closed | $368,207 | FHA | |
| Previous Owner | $281,084 | FHA |
Source: Public Records
Property History
| Date | Event | Price | Change | Sq Ft Price |
|---|---|---|---|---|
| 12/21/2018 12/21/18 | Sold | $375,000 | 0.0% | $196 / Sq Ft |
| 11/12/2018 11/12/18 | Pending | -- | -- | -- |
| 11/05/2018 11/05/18 | Price Changed | $374,900 | -2.6% | $196 / Sq Ft |
| 10/13/2018 10/13/18 | For Sale | $384,900 | 0.0% | $201 / Sq Ft |
| 10/07/2018 10/07/18 | Pending | -- | -- | -- |
| 10/06/2018 10/06/18 | Price Changed | $384,900 | +2.7% | $201 / Sq Ft |
| 10/05/2018 10/05/18 | Price Changed | $374,900 | -5.1% | $196 / Sq Ft |
| 09/25/2018 09/25/18 | For Sale | $394,900 | +46.3% | $207 / Sq Ft |
| 08/28/2015 08/28/15 | Sold | $270,000 | -3.5% | $144 / Sq Ft |
| 07/29/2015 07/29/15 | Pending | -- | -- | -- |
| 06/07/2015 06/07/15 | For Sale | $279,900 | +133.3% | $150 / Sq Ft |
| 09/24/2013 09/24/13 | Sold | $120,000 | +9.1% | $64 / Sq Ft |
| 08/25/2013 08/25/13 | Pending | -- | -- | -- |
| 03/24/2013 03/24/13 | For Sale | $110,000 | -- | $59 / Sq Ft |
Source: MLS Property Information Network (MLS PIN)
Tax History Compared to Growth
Tax History
| Year | Tax Paid | Tax Assessment Tax Assessment Total Assessment is a certain percentage of the fair market value that is determined by local assessors to be the total taxable value of land and additions on the property. | Land | Improvement |
|---|---|---|---|---|
| 2025 | $5,582 | $486,200 | $107,400 | $378,800 |
| 2024 | $5,183 | $435,200 | $100,400 | $334,800 |
| 2023 | $4,823 | $388,300 | $87,300 | $301,000 |
| 2022 | $4,331 | $341,300 | $69,000 | $272,300 |
| 2021 | $4,018 | $298,500 | $60,000 | $238,500 |
| 2020 | $3,739 | $279,900 | $60,000 | $219,900 |
| 2019 | $3,824 | $272,400 | $57,000 | $215,400 |
| 2018 | $3,567 | $247,300 | $54,300 | $193,000 |
| 2017 | $3,415 | $228,900 | $52,700 | $176,200 |
| 2016 | $2,821 | $186,100 | $48,900 | $137,200 |
| 2015 | $2,861 | $184,800 | $48,900 | $135,900 |
| 2013 | $2,418 | $161,100 | $58,700 | $102,400 |
Source: Public Records
Agents Affiliated with this Home
-
Paul-Ratha Yem
Seller's Agent in 2018
Paul-Ratha Yem
Global Realty Network, Inc.
(617) 459-3000
10 in this area
41 Total Sales
-
Sam Meas
Seller Co-Listing Agent in 2018
Sam Meas
Amatak Global Realty LLC
(781) 696-1324
1 in this area
9 Total Sales
-
Borath Men
B
Buyer's Agent in 2018
Borath Men
Homeplace Realty, Inc.
(978) 423-9750
29 in this area
113 Total Sales
-
V
Seller's Agent in 2015
Van Son
Mass Broker Services
-
D
Buyer's Agent in 2015
Doeun Uy
Citiwide Real Estate
Map
Source: MLS Property Information Network (MLS PIN)
MLS Number: 72401063
APN: LOWE-000143-000990-000062
Disclaimer: Certain information contained herein is derived from information provided by parties other than Homes.com. All information provided is deemed reliable, but is not guaranteed to be accurate and should be independently verified.
![]() The property listing data and information, or the Images, set forth herein were provided to MLS Property Information Network, Inc. from third party sources, including sellers, lessors and public records, and were compiled by MLS Property Information Network, Inc. The property listing data and information, and the Images, are for the personal, non-commercial use of consumers having a good faith interest in purchasing or leasing listed properties of the type displayed to them and may not be used for any purpose other than to identify prospective properties which such consumers may have a good faith interest in purchasing or leasing. MLS Property Information Network, Inc. and its subscribers disclaim any and all representations and warranties as to the accuracy of the property listing data and information, or as to the accuracy of any of the Images, set forth herein.
The property listing data and information, or the Images, set forth herein were provided to MLS Property Information Network, Inc. from third party sources, including sellers, lessors and public records, and were compiled by MLS Property Information Network, Inc. The property listing data and information, and the Images, are for the personal, non-commercial use of consumers having a good faith interest in purchasing or leasing listed properties of the type displayed to them and may not be used for any purpose other than to identify prospective properties which such consumers may have a good faith interest in purchasing or leasing. MLS Property Information Network, Inc. and its subscribers disclaim any and all representations and warranties as to the accuracy of the property listing data and information, or as to the accuracy of any of the Images, set forth herein.
Nearby Homes
- 113 Bellevue St
- 97 Gates St
- 15 Barclay St
- 201 Thorndike St Unit 501
- 110 Smith St Unit 3
- 32-34 Poplar St
- 31 Waite St
- 65 Smith St
- 45 Marshall St
- 17 Burns St Unit 2
- 17 Burns St Unit 1
- 17 Burns St Unit D
- 17 Burns St Unit C
- 27 Butler Ave
- 6 Mcintyre St
- 613 School St
- 43 Cedar St
- 18 Cedar St
- 6 Favor St
- 241 Plain St