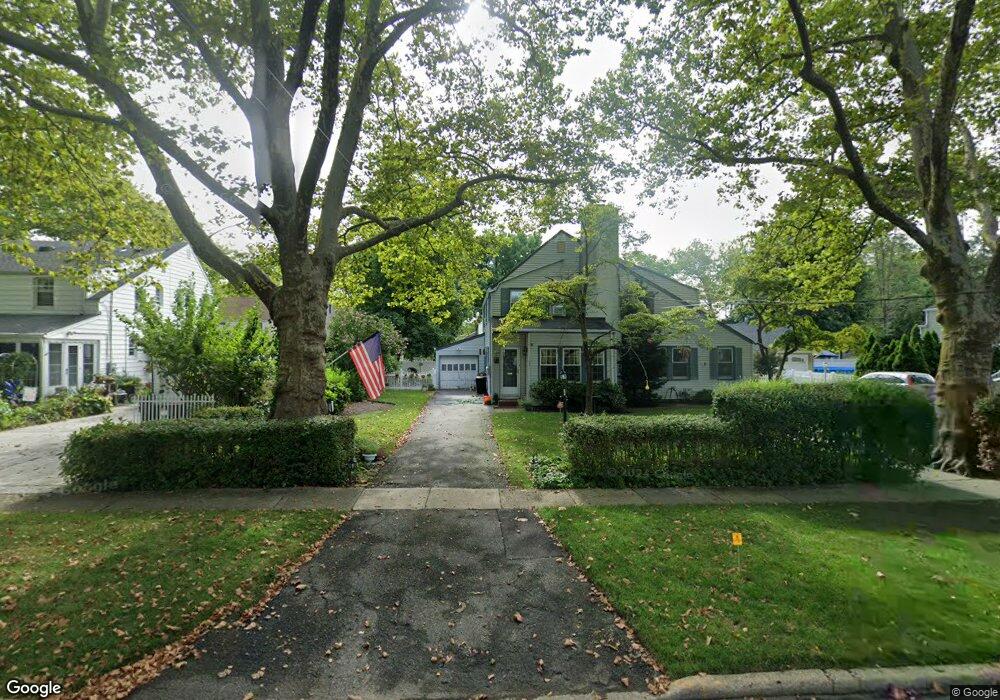
62 Dover Pkwy Garden City, NY 11530
Estimated Value: $735,000 - $788,226
3
Beds
2
Baths
1,340
Sq Ft
$568/Sq Ft
Est. Value
About This Home
This home is located at 62 Dover Pkwy, Garden City, NY 11530 and is currently estimated at $761,613, approximately $568 per square foot. 62 Dover Pkwy is a home located in Nassau County with nearby schools including St Anne's School.
Ownership History
Date
Name
Owned For
Owner Type
Purchase Details
Closed on
May 20, 2021
Sold by
Leone Marianne and Delgrosso Donna
Bought by
Monaghan Michael and Vosvick Chastine
Current Estimated Value
Home Financials for this Owner
Home Financials are based on the most recent Mortgage that was taken out on this home.
Original Mortgage
$508,250
Outstanding Balance
$459,154
Interest Rate
2.9%
Mortgage Type
New Conventional
Estimated Equity
$302,459
Purchase Details
Closed on
Apr 5, 2018
Sold by
Kalbacher Donald E and Kalbacher Joan
Bought by
Kalbacher Donald E
Create a Home Valuation Report for This Property
The Home Valuation Report is an in-depth analysis detailing your home's value as well as a comparison with similar homes in the area
Home Values in the Area
Average Home Value in this Area
Purchase History
| Date | Buyer | Sale Price | Title Company |
|---|---|---|---|
| Monaghan Michael | $535,000 | First American Title | |
| Kalbacher Donald E | -- | -- |
Source: Public Records
Mortgage History
| Date | Status | Borrower | Loan Amount |
|---|---|---|---|
| Open | Monaghan Michael | $508,250 |
Source: Public Records
Tax History Compared to Growth
Tax History
| Year | Tax Paid | Tax Assessment Tax Assessment Total Assessment is a certain percentage of the fair market value that is determined by local assessors to be the total taxable value of land and additions on the property. | Land | Improvement |
|---|---|---|---|---|
| 2025 | $12,519 | $592 | $258 | $334 |
| 2024 | $2,255 | $592 | $258 | $334 |
| 2023 | $11,442 | $592 | $258 | $334 |
| 2022 | $11,442 | $592 | $258 | $334 |
| 2021 | $11,211 | $560 | $246 | $314 |
| 2020 | $5,667 | $529 | $528 | $1 |
| 2019 | $1,300 | $566 | $565 | $1 |
| 2018 | $1,322 | $604 | $0 | $0 |
| 2017 | $4,957 | $642 | $641 | $1 |
| 2016 | $6,305 | $679 | $646 | $33 |
| 2015 | $1,325 | $717 | $682 | $35 |
| 2014 | $1,325 | $717 | $682 | $35 |
| 2013 | $1,443 | $755 | $718 | $37 |
Source: Public Records
Map
Nearby Homes