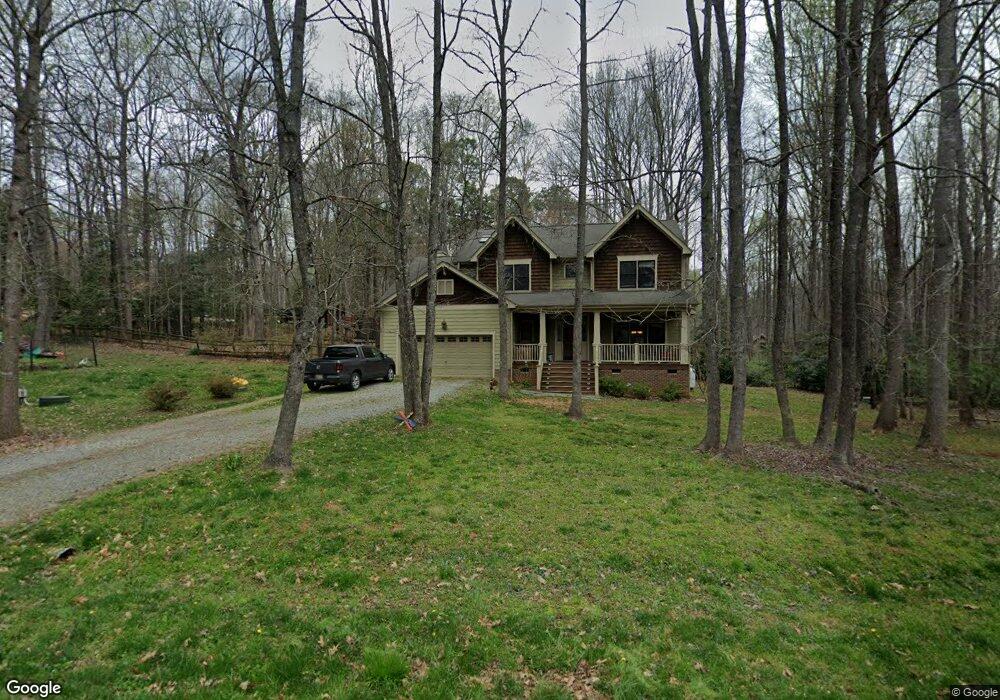
62 Hamlet Grove Dr Pittsboro, NC 27312
Estimated Value: $586,117 - $698,000
4
Beds
3
Baths
2,331
Sq Ft
$274/Sq Ft
Est. Value
About This Home
This home is located at 62 Hamlet Grove Dr, Pittsboro, NC 27312 and is currently estimated at $639,779, approximately $274 per square foot. 62 Hamlet Grove Dr is a home located in Chatham County with nearby schools including Perry W. Harrison Elementary School, Margaret B. Pollard Middle School, and Northwood High.
Ownership History
Date
Name
Owned For
Owner Type
Purchase Details
Closed on
Mar 22, 2017
Sold by
Nichols Kevin and Nichols Rachel
Bought by
Walker Harrison Lee Anne and Walker Harrison Nicholas
Current Estimated Value
Home Financials for this Owner
Home Financials are based on the most recent Mortgage that was taken out on this home.
Original Mortgage
$271,920
Outstanding Balance
$224,886
Interest Rate
4.16%
Mortgage Type
New Conventional
Estimated Equity
$414,893
Purchase Details
Closed on
Feb 21, 2014
Sold by
Secu*Re Inc
Bought by
Nichols Kevin and Roberson Rachel S
Purchase Details
Closed on
Oct 16, 2013
Sold by
Garris Kenneth and Garris Leslie
Bought by
Secu Re
Purchase Details
Closed on
Feb 16, 2009
Sold by
Mccarty Gregory and Sombers Leslie
Bought by
Garris Kenneth and Garris Leslie
Home Financials for this Owner
Home Financials are based on the most recent Mortgage that was taken out on this home.
Original Mortgage
$307,500
Interest Rate
4.25%
Mortgage Type
Purchase Money Mortgage
Create a Home Valuation Report for This Property
The Home Valuation Report is an in-depth analysis detailing your home's value as well as a comparison with similar homes in the area
Home Values in the Area
Average Home Value in this Area
Purchase History
| Date | Buyer | Sale Price | Title Company |
|---|---|---|---|
| Walker Harrison Lee Anne | $344,000 | Attorney | |
| Nichols Kevin | $315,000 | -- | |
| Secu Re | $330,000 | None Available | |
| Garris Kenneth | $307,500 | None Available |
Source: Public Records
Mortgage History
| Date | Status | Borrower | Loan Amount |
|---|---|---|---|
| Open | Walker Harrison Lee Anne | $271,920 | |
| Previous Owner | Garris Kenneth | $307,500 |
Source: Public Records
Tax History Compared to Growth
Tax History
| Year | Tax Paid | Tax Assessment Tax Assessment Total Assessment is a certain percentage of the fair market value that is determined by local assessors to be the total taxable value of land and additions on the property. | Land | Improvement |
|---|---|---|---|---|
| 2025 | $3,574 | $486,714 | $91,180 | $395,534 |
| 2024 | $3,574 | $328,068 | $72,538 | $255,530 |
| 2023 | $2,935 | $328,068 | $72,538 | $255,530 |
| 2022 | $2,694 | $328,068 | $72,538 | $255,530 |
| 2021 | $2,661 | $328,068 | $72,538 | $255,530 |
| 2020 | $2,564 | $313,467 | $49,316 | $264,151 |
| 2019 | $2,564 | $313,467 | $49,316 | $264,151 |
| 2018 | $2,417 | $313,467 | $49,316 | $264,151 |
| 2017 | $2,383 | $313,467 | $49,316 | $264,151 |
| 2016 | $2,610 | $341,917 | $54,796 | $287,121 |
| 2015 | $2,570 | $341,917 | $54,796 | $287,121 |
| 2014 | -- | $341,917 | $54,796 | $287,121 |
| 2013 | -- | $341,917 | $54,796 | $287,121 |
Source: Public Records
Map
Nearby Homes
- 0 Bygone Way
- 50 Harrison Pond Dr
- 4025 Hamlets Chapel Rd
- 0 Hamlets Chapel Rd Unit 10024186
- 00 Hamlets Chapel Rd
- 196 Paces Mill Trail
- 58 Mint Springs Rd
- 205 Riverine Dr
- 33 Versailles Ln
- 480 Lila Dr
- 67 Ada Ct
- 441 Lila Dr
- 405 Lila Dr
- 346 Lila Dr
- 339 Lila Dr
- 114 Margaret Mann Way
- 236 Emelia Ln
- 112 Noble Reserve Way
- 140 Noble Reserve Way
- 588 Rufus C Burnette Dr
- TBD Hamlet Chapel Rd
- #4 Hamlet Grove Dr
- #3 Hamlet Grove Dr
- #6 Hamlet Grove Dr
- #11 Hamlet Grove Dr
- 120 Hamlet Grove Dr
- 20 Hamlet Grove Dr
- 81 Hamlet Grove Dr
- 55 Hamlet Grove Dr
- 55 Hamlet Grove Dr Unit 34
- 170 Hamlet Grove Dr
- 3209 Hamlet Chapel Rd
- 105 Hamlet Grove Dr
- 3209 Hamlets Chapel Rd
- 194 Hamlet Grove Dr
- 135 Hamlet Grove Dr
- 145 Harrison Ct
- 4 Blair Ln
- 26 Harrison Ct
- 191 Hamlet Grove Dr