62 N High St Foxboro, MA 02035
Estimated Value: $604,000 - $838,000
4
Beds
3
Baths
1,636
Sq Ft
$418/Sq Ft
Est. Value
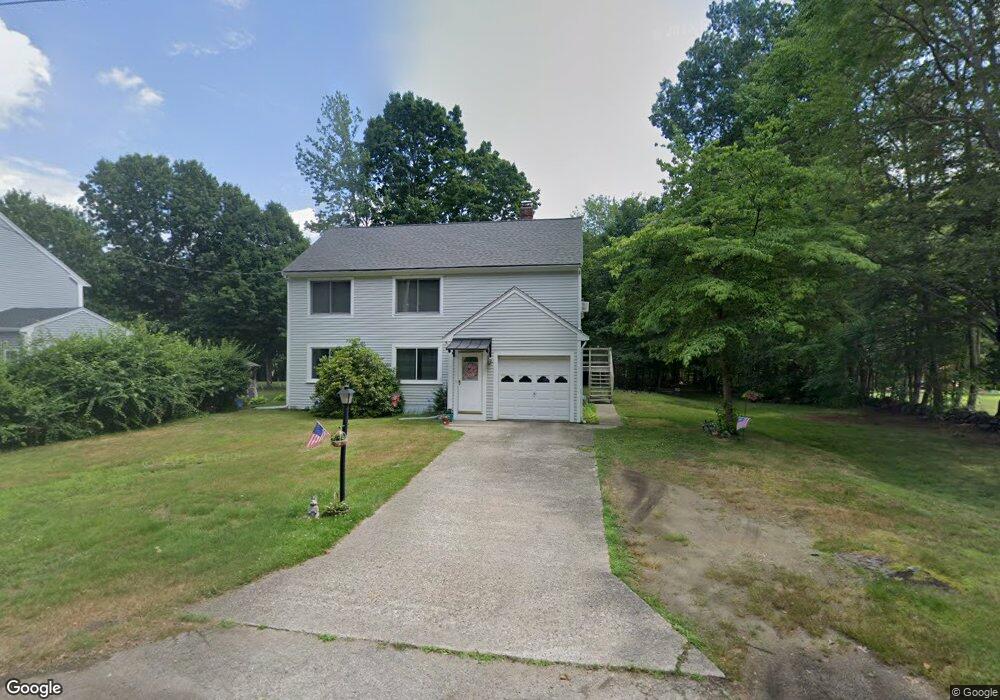
About This Home
This home is located at 62 N High St, Foxboro, MA 02035 and is currently estimated at $684,011, approximately $418 per square foot. 62 N High St is a home located in Norfolk County with nearby schools including Foxborough High School, Foxborough Regional Charter School, and Hands-On-Montessori School.
Ownership History
Date
Name
Owned For
Owner Type
Purchase Details
Closed on
May 20, 1992
Sold by
Robillard Lisa S
Bought by
Ollis Charles E
Current Estimated Value
Home Financials for this Owner
Home Financials are based on the most recent Mortgage that was taken out on this home.
Original Mortgage
$90,000
Interest Rate
8.77%
Mortgage Type
Purchase Money Mortgage
Purchase Details
Closed on
Mar 28, 1989
Sold by
Lahey Lawrence
Bought by
Ollis Charles E
Home Financials for this Owner
Home Financials are based on the most recent Mortgage that was taken out on this home.
Original Mortgage
$100,000
Interest Rate
10.49%
Mortgage Type
Purchase Money Mortgage
Create a Home Valuation Report for This Property
The Home Valuation Report is an in-depth analysis detailing your home's value as well as a comparison with similar homes in the area
Home Values in the Area
Average Home Value in this Area
Purchase History
| Date | Buyer | Sale Price | Title Company |
|---|---|---|---|
| Ollis Charles E | $12,300 | -- | |
| Ollis Charles E | $130,000 | -- |
Source: Public Records
Mortgage History
| Date | Status | Borrower | Loan Amount |
|---|---|---|---|
| Open | Ollis Charles E | $86,200 | |
| Closed | Ollis Charles E | $90,000 | |
| Previous Owner | Ollis Charles E | $96,000 | |
| Previous Owner | Ollis Charles E | $100,000 |
Source: Public Records
Tax History Compared to Growth
Tax History
| Year | Tax Paid | Tax Assessment Tax Assessment Total Assessment is a certain percentage of the fair market value that is determined by local assessors to be the total taxable value of land and additions on the property. | Land | Improvement |
|---|---|---|---|---|
| 2025 | $5,862 | $443,400 | $220,000 | $223,400 |
| 2024 | $5,866 | $434,200 | $220,000 | $214,200 |
| 2023 | $5,695 | $400,800 | $209,400 | $191,400 |
| 2022 | $5,635 | $388,100 | $200,300 | $187,800 |
| 2021 | $5,405 | $366,700 | $182,100 | $184,600 |
| 2020 | $5,251 | $360,400 | $182,100 | $178,300 |
| 2019 | $4,985 | $339,100 | $173,400 | $165,700 |
| 2018 | $4,872 | $334,400 | $173,400 | $161,000 |
| 2017 | $4,692 | $312,000 | $162,100 | $149,900 |
| 2016 | $4,530 | $305,700 | $156,000 | $149,700 |
| 2015 | $4,394 | $289,300 | $131,700 | $157,600 |
| 2014 | $4,271 | $284,900 | $129,100 | $155,800 |
Source: Public Records
Map
Nearby Homes
- 12 Spring St
- 356 Central St
- 277 Central St
- 11 W Belcher Rd Unit 2
- 80 Mill St
- 450 West St
- 166 Chauncy St
- 18 Winter St Unit E
- 406 South St
- 14 Winter St Unit B
- 84 Cocasset St Unit A6
- 28 Angell St
- 44 Angell St Unit 44
- 24 Mechanic St
- 619 N Main St
- 14 Baker St
- 11 Orchard Place Unit 11
- 22 Pleasant St Unit C
- 82 Brook St
- 28 Court St