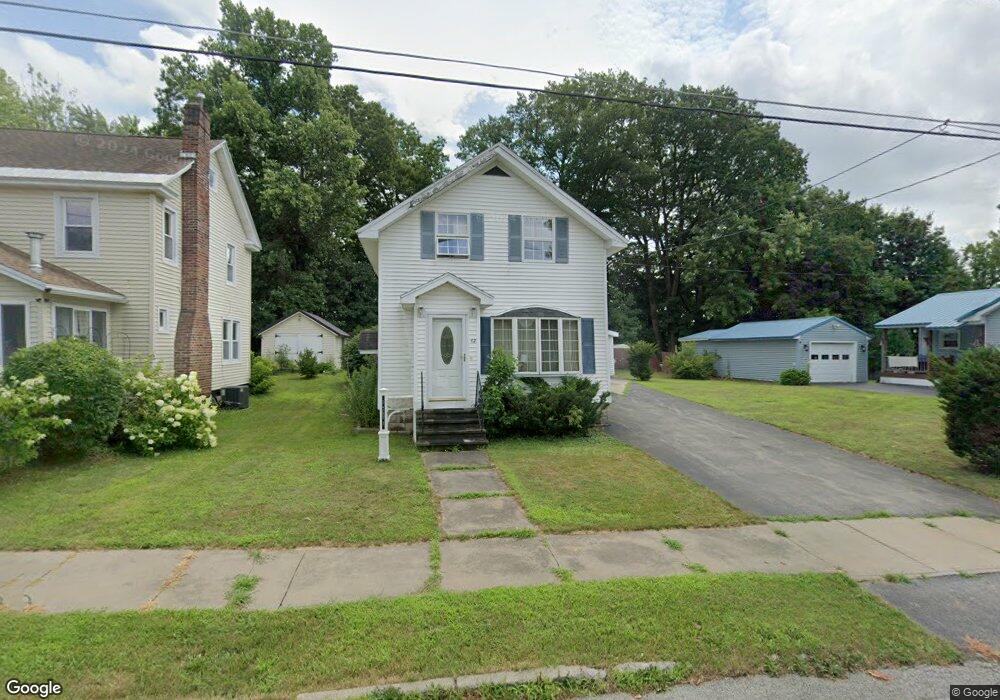
62 Walnut St Gloversville, NY 12078
Estimated Value: $91,000 - $128,000
3
Beds
1
Bath
1,172
Sq Ft
$93/Sq Ft
Est. Value
About This Home
This home is located at 62 Walnut St, Gloversville, NY 12078 and is currently estimated at $109,149, approximately $93 per square foot. 62 Walnut St is a home located in Fulton County with nearby schools including Boulevard School, Gloversville Middle School, and Gloversville High School.
Ownership History
Date
Name
Owned For
Owner Type
Purchase Details
Closed on
May 2, 2025
Sold by
Fremont Donald J and Fremont Brenda L
Bought by
Hine Nancy
Current Estimated Value
Home Financials for this Owner
Home Financials are based on the most recent Mortgage that was taken out on this home.
Original Mortgage
$167,848
Outstanding Balance
$167,256
Interest Rate
6.67%
Mortgage Type
Purchase Money Mortgage
Estimated Equity
-$58,107
Purchase Details
Closed on
Mar 29, 1999
Create a Home Valuation Report for This Property
The Home Valuation Report is an in-depth analysis detailing your home's value as well as a comparison with similar homes in the area
Home Values in the Area
Average Home Value in this Area
Purchase History
| Date | Buyer | Sale Price | Title Company |
|---|---|---|---|
| Hine Nancy | $90,000 | None Available | |
| -- | -- | -- | |
| -- | -- | -- |
Source: Public Records
Mortgage History
| Date | Status | Borrower | Loan Amount |
|---|---|---|---|
| Open | Hine Nancy | $167,848 |
Source: Public Records
Tax History Compared to Growth
Tax History
| Year | Tax Paid | Tax Assessment Tax Assessment Total Assessment is a certain percentage of the fair market value that is determined by local assessors to be the total taxable value of land and additions on the property. | Land | Improvement |
|---|---|---|---|---|
| 2024 | $2,113 | $64,000 | $11,800 | $52,200 |
| 2023 | $2,007 | $64,000 | $11,800 | $52,200 |
| 2022 | $525 | $64,000 | $11,800 | $52,200 |
| 2021 | $481 | $64,000 | $11,800 | $52,200 |
| 2020 | $544 | $64,000 | $11,800 | $52,200 |
| 2019 | $1,085 | $64,000 | $11,800 | $52,200 |
| 2018 | $1,634 | $64,000 | $11,800 | $52,200 |
| 2017 | $538 | $64,000 | $11,800 | $52,200 |
| 2016 | $563 | $64,000 | $11,800 | $52,200 |
| 2015 | -- | $64,000 | $11,800 | $52,200 |
| 2014 | -- | $64,000 | $11,800 | $52,200 |
Source: Public Records
Map
Nearby Homes