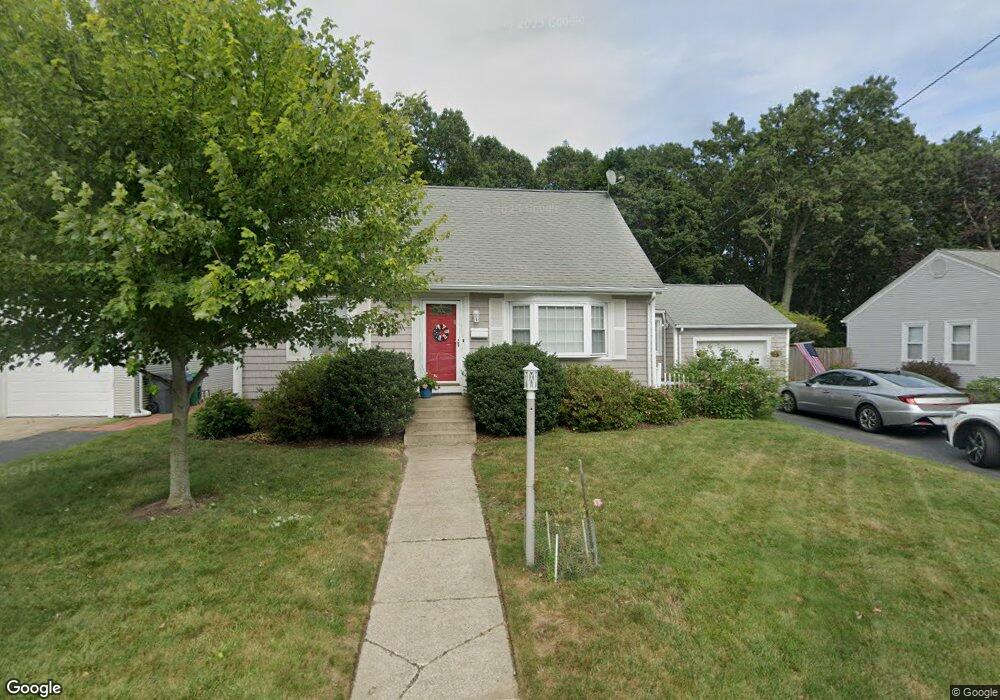
62 Welfare Ave Warwick, RI 02888
Norwood NeighborhoodEstimated Value: $355,000 - $420,000
4
Beds
1
Bath
1,166
Sq Ft
$327/Sq Ft
Est. Value
About This Home
This home is located at 62 Welfare Ave, Warwick, RI 02888 and is currently estimated at $381,034, approximately $326 per square foot. 62 Welfare Ave is a home located in Kent County with nearby schools including St. Peter School.
Ownership History
Date
Name
Owned For
Owner Type
Purchase Details
Closed on
May 6, 2002
Sold by
M-Passeroni Regina M
Bought by
Mathews Karen J and Obrien Michael M
Current Estimated Value
Purchase Details
Closed on
May 26, 2000
Sold by
Murray Mary G
Bought by
M-Passeroni Regina M
Create a Home Valuation Report for This Property
The Home Valuation Report is an in-depth analysis detailing your home's value as well as a comparison with similar homes in the area
Home Values in the Area
Average Home Value in this Area
Purchase History
| Date | Buyer | Sale Price | Title Company |
|---|---|---|---|
| Mathews Karen J | $148,000 | -- | |
| M-Passeroni Regina M | $47,000 | -- | |
| Mathews Karen J | $148,000 | -- | |
| M-Passeroni Regina M | $47,000 | -- |
Source: Public Records
Mortgage History
| Date | Status | Borrower | Loan Amount |
|---|---|---|---|
| Open | M-Passeroni Regina M | $209,320 | |
| Closed | M-Passeroni Regina M | $222,323 | |
| Closed | M-Passeroni Regina M | $181,000 |
Source: Public Records
Tax History Compared to Growth
Tax History
| Year | Tax Paid | Tax Assessment Tax Assessment Total Assessment is a certain percentage of the fair market value that is determined by local assessors to be the total taxable value of land and additions on the property. | Land | Improvement |
|---|---|---|---|---|
| 2025 | $4,489 | $353,500 | $109,400 | $244,100 |
| 2024 | $4,348 | $300,500 | $95,100 | $205,400 |
| 2023 | $4,168 | $293,700 | $88,300 | $205,400 |
| 2022 | $3,961 | $211,500 | $57,400 | $154,100 |
| 2021 | $3,961 | $211,500 | $57,400 | $154,100 |
| 2020 | $3,961 | $211,500 | $57,400 | $154,100 |
| 2019 | $3,961 | $211,500 | $57,400 | $154,100 |
| 2018 | $3,586 | $172,400 | $57,400 | $115,000 |
| 2017 | $3,489 | $172,400 | $57,400 | $115,000 |
| 2016 | $3,489 | $172,400 | $57,400 | $115,000 |
| 2015 | $3,193 | $153,900 | $56,400 | $97,500 |
| 2014 | $3,087 | $153,900 | $56,400 | $97,500 |
| 2013 | $3,046 | $153,900 | $56,400 | $97,500 |
Source: Public Records
Map
Nearby Homes