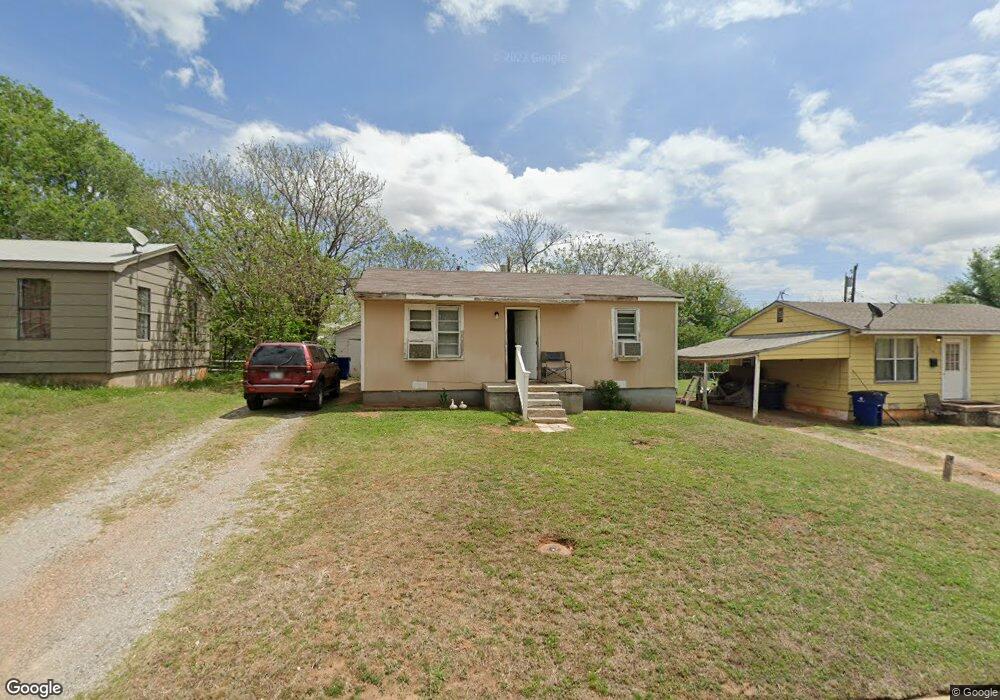
620 N I St Duncan, OK 73533
Estimated Value: $40,000 - $225,000
2
Beds
1
Bath
690
Sq Ft
$192/Sq Ft
Est. Value
About This Home
This home is located at 620 N I St, Duncan, OK 73533 and is currently estimated at $132,527, approximately $192 per square foot. 620 N I St is a home located in Stephens County with nearby schools including Woodrow Wilson Elementary School, Duncan Middle School, and Duncan High School.
Ownership History
Date
Name
Owned For
Owner Type
Purchase Details
Closed on
May 13, 2022
Sold by
Jennings Properties Llc
Bought by
Battiest Walker and Battiest Jamie
Current Estimated Value
Purchase Details
Closed on
Nov 16, 2010
Sold by
Bayview Loan Servicing Llc
Bought by
Red Hot Properties Llp
Purchase Details
Closed on
Aug 31, 2010
Sold by
Swartz & Brough Inc
Bought by
Bayview Loan Servicing Llc
Purchase Details
Closed on
Jun 15, 2010
Sold by
Allport Sharon A and Doe John
Bought by
Swartz & Brough Inc
Purchase Details
Closed on
Apr 15, 2005
Sold by
Swartz & Brough Inc
Bought by
Allport Sharon A and Allport Keith M
Home Financials for this Owner
Home Financials are based on the most recent Mortgage that was taken out on this home.
Original Mortgage
$19,800
Interest Rate
6.03%
Mortgage Type
Purchase Money Mortgage
Create a Home Valuation Report for This Property
The Home Valuation Report is an in-depth analysis detailing your home's value as well as a comparison with similar homes in the area
Home Values in the Area
Average Home Value in this Area
Purchase History
| Date | Buyer | Sale Price | Title Company |
|---|---|---|---|
| Battiest Walker | $65,000 | None Listed On Document | |
| Red Hot Properties Llp | $7,500 | Stewart Abstract & Title Of | |
| Bayview Loan Servicing Llc | -- | None Available | |
| Swartz & Brough Inc | $17,971 | None Available | |
| Allport Sharon A | $22,000 | None Available |
Source: Public Records
Mortgage History
| Date | Status | Borrower | Loan Amount |
|---|---|---|---|
| Previous Owner | Allport Sharon A | $19,800 |
Source: Public Records
Tax History Compared to Growth
Tax History
| Year | Tax Paid | Tax Assessment Tax Assessment Total Assessment is a certain percentage of the fair market value that is determined by local assessors to be the total taxable value of land and additions on the property. | Land | Improvement |
|---|---|---|---|---|
| 2025 | $123 | $1,452 | $294 | $1,158 |
| 2024 | $118 | $1,384 | $294 | $1,090 |
| 2023 | $118 | $1,383 | $294 | $1,089 |
| 2022 | $107 | $1,318 | $294 | $1,024 |
| 2021 | $106 | $1,255 | $294 | $961 |
| 2020 | $98 | $1,138 | $294 | $844 |
| 2019 | $94 | $1,084 | $294 | $790 |
| 2018 | $92 | $1,084 | $294 | $790 |
| 2017 | $84 | $1,033 | $294 | $739 |
| 2016 | $80 | $937 | $294 | $643 |
| 2015 | $172 | $1,650 | $294 | $1,356 |
| 2014 | $172 | $1,650 | $294 | $1,356 |
Source: Public Records
Map
Nearby Homes