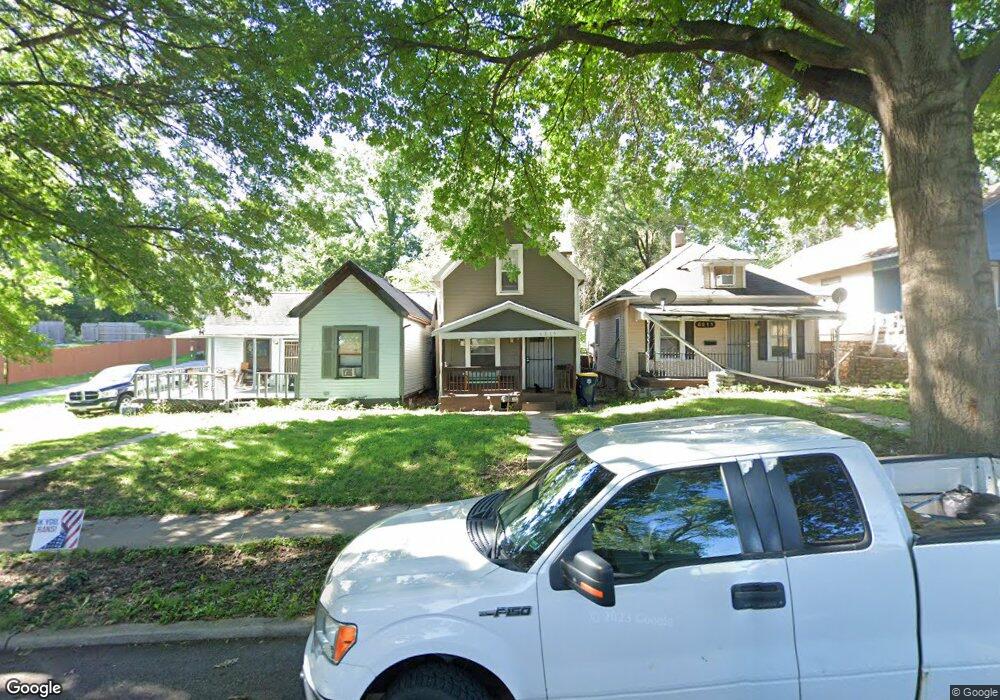
6215 E 9th St Kansas City, MO 64125
Sheffield NeighborhoodEstimated Value: $99,487 - $137,000
2
Beds
1
Bath
890
Sq Ft
$127/Sq Ft
Est. Value
About This Home
This home is located at 6215 E 9th St, Kansas City, MO 64125 and is currently estimated at $112,622, approximately $126 per square foot. 6215 E 9th St is a home located in Jackson County with nearby schools including Rogers Elementary School, Northeast Middle School, and East High School.
Ownership History
Date
Name
Owned For
Owner Type
Purchase Details
Closed on
Jan 24, 2020
Sold by
1 Big Red Llc
Bought by
Yang Jack
Current Estimated Value
Home Financials for this Owner
Home Financials are based on the most recent Mortgage that was taken out on this home.
Original Mortgage
$62,400
Outstanding Balance
$55,239
Interest Rate
3.7%
Mortgage Type
New Conventional
Estimated Equity
$57,383
Purchase Details
Closed on
Feb 25, 2019
Sold by
Baluran Holdings Llc
Bought by
1 Big Red Llc
Home Financials for this Owner
Home Financials are based on the most recent Mortgage that was taken out on this home.
Original Mortgage
$250,000
Interest Rate
4.4%
Mortgage Type
Commercial
Purchase Details
Closed on
Apr 15, 2013
Sold by
American Real Estate Investments Llc
Bought by
Baluran Holdings Llc
Create a Home Valuation Report for This Property
The Home Valuation Report is an in-depth analysis detailing your home's value as well as a comparison with similar homes in the area
Home Values in the Area
Average Home Value in this Area
Purchase History
| Date | Buyer | Sale Price | Title Company |
|---|---|---|---|
| Yang Jack | -- | None Available | |
| 1 Big Red Llc | -- | Alpha Title Guaranty Inc | |
| Baluran Holdings Llc | -- | None Available |
Source: Public Records
Mortgage History
| Date | Status | Borrower | Loan Amount |
|---|---|---|---|
| Open | Yang Jack | $62,400 | |
| Previous Owner | 1 Big Red Llc | $250,000 |
Source: Public Records
Tax History Compared to Growth
Tax History
| Year | Tax Paid | Tax Assessment Tax Assessment Total Assessment is a certain percentage of the fair market value that is determined by local assessors to be the total taxable value of land and additions on the property. | Land | Improvement |
|---|---|---|---|---|
| 2025 | $1,245 | $4,522 | $2,314 | $2,208 |
| 2024 | $1,233 | $15,770 | $1,830 | $13,940 |
| 2023 | $1,233 | $15,770 | $1,830 | $13,940 |
| 2022 | $281 | $3,420 | $665 | $2,755 |
| 2021 | $280 | $3,420 | $665 | $2,755 |
| 2020 | $269 | $3,241 | $665 | $2,576 |
| 2019 | $263 | $3,241 | $665 | $2,576 |
| 2018 | $243 | $3,056 | $466 | $2,590 |
| 2017 | $233 | $3,056 | $466 | $2,590 |
| 2016 | $233 | $2,912 | $278 | $2,634 |
| 2014 | $234 | $2,912 | $278 | $2,634 |
Source: Public Records
Map
Nearby Homes
- 6225 E 10th and 6227 St
- 807 Beacon Ave
- 6015 E 9th St
- 730 Bennington Ave
- 5809 E 11th St
- 901 Ewing Ave
- 729 Ewing Ave
- 902 Cambridge Ave
- 1301 Bennington Ave
- 1310 Bennington Ave
- 1236 Topping Ave
- 1120 Oakley Ave
- 1511 Belmont Ave
- 6228 E 15th Terrace
- 6837 E 13th St
- 515 Oakley Ave
- 7001 E 12th Terrace
- 1217 Hardesty Ave
- 318 Belmont Blvd
- 6012 E 16th St