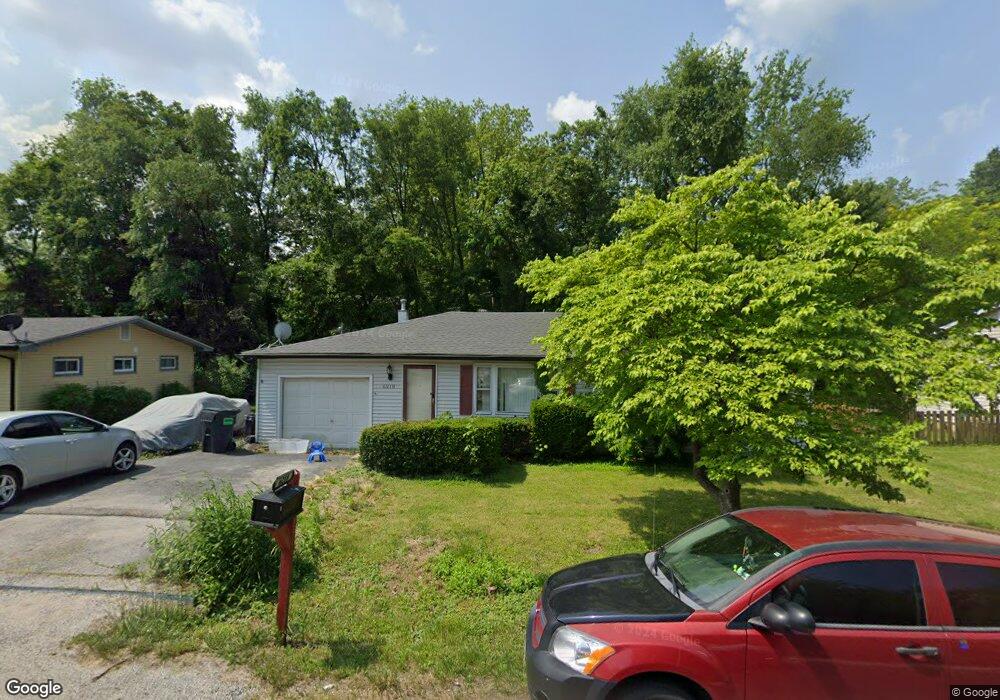
6218 Warren Dr Belleville, IL 62223
Estimated Value: $111,000 - $131,316
3
Beds
1
Bath
940
Sq Ft
$130/Sq Ft
Est. Value
About This Home
This home is located at 6218 Warren Dr, Belleville, IL 62223 and is currently estimated at $122,329, approximately $130 per square foot. 6218 Warren Dr is a home located in St. Clair County with nearby schools including Ellis Elementary School, Emge Junior High School, and Our Lady Queen Of Peace Catholic School.
Ownership History
Date
Name
Owned For
Owner Type
Purchase Details
Closed on
Aug 25, 2017
Sold by
Reeb Stephen E and Reeb Beverly A
Bought by
Loesche Jonathan T and Loesche Lisa
Current Estimated Value
Home Financials for this Owner
Home Financials are based on the most recent Mortgage that was taken out on this home.
Original Mortgage
$487,900
Interest Rate
4.03%
Mortgage Type
Commercial
Purchase Details
Closed on
Dec 16, 2011
Sold by
Killion Cynthia Sue
Bought by
Reeb Stephen and Reeb Beverly
Home Financials for this Owner
Home Financials are based on the most recent Mortgage that was taken out on this home.
Original Mortgage
$62,400
Interest Rate
3.99%
Mortgage Type
Future Advance Clause Open End Mortgage
Purchase Details
Closed on
Feb 21, 2008
Sold by
Arburn Dorothy Mae
Bought by
Killion Cynthia Sue
Create a Home Valuation Report for This Property
The Home Valuation Report is an in-depth analysis detailing your home's value as well as a comparison with similar homes in the area
Home Values in the Area
Average Home Value in this Area
Purchase History
| Date | Buyer | Sale Price | Title Company |
|---|---|---|---|
| Loesche Jonathan T | $574,000 | Fatic | |
| Reeb Stephen | $53,500 | Old Title & Escrow | |
| Killion Cynthia Sue | -- | None Available |
Source: Public Records
Mortgage History
| Date | Status | Borrower | Loan Amount |
|---|---|---|---|
| Closed | Loesche Jonathan T | $487,900 | |
| Previous Owner | Reeb Stephen | $62,400 |
Source: Public Records
Tax History Compared to Growth
Tax History
| Year | Tax Paid | Tax Assessment Tax Assessment Total Assessment is a certain percentage of the fair market value that is determined by local assessors to be the total taxable value of land and additions on the property. | Land | Improvement |
|---|---|---|---|---|
| 2024 | $2,293 | $27,299 | $4,120 | $23,179 |
| 2023 | $2,144 | $24,495 | $3,697 | $20,798 |
| 2022 | $2,036 | $22,228 | $3,355 | $18,873 |
| 2021 | $1,962 | $20,637 | $3,115 | $17,522 |
| 2020 | $1,974 | $20,077 | $3,031 | $17,046 |
| 2019 | $1,968 | $20,077 | $3,031 | $17,046 |
| 2018 | $1,911 | $19,185 | $2,896 | $16,289 |
| 2017 | $2,038 | $17,868 | $2,697 | $15,171 |
| 2016 | $2,212 | $21,992 | $4,034 | $17,958 |
| 2014 | $2,006 | $22,118 | $4,057 | $18,061 |
| 2013 | $1,933 | $23,597 | $4,328 | $19,269 |
Source: Public Records
Map
Nearby Homes
- 6204 Warren Dr
- 18 Jonathon Lee Dr
- 22 Terrace Dr
- 2819 Frank Scott Pkwy W
- 408 Rosewood Ct
- 57 Cheshire Dr
- 130 Hickory Lake
- 41 Paulette Dr
- 102 Kensington Heights Rd
- 40 Irene Dr
- 22 Elizabeth Dr
- 4720 Ruth St
- 11 Pinecrest Cir
- 11 Kingsway Dr
- 2264 Frank Scott Pkwy W
- 44 Gatewood Ct
- 4619 Ruth St
- 119 Freedom Dr
- 128 Freedom Dr
- 8 S 51st St