Estimated Value: $1,510,004 - $1,991,000
3
Beds
3
Baths
2,034
Sq Ft
$861/Sq Ft
Est. Value
About This Home
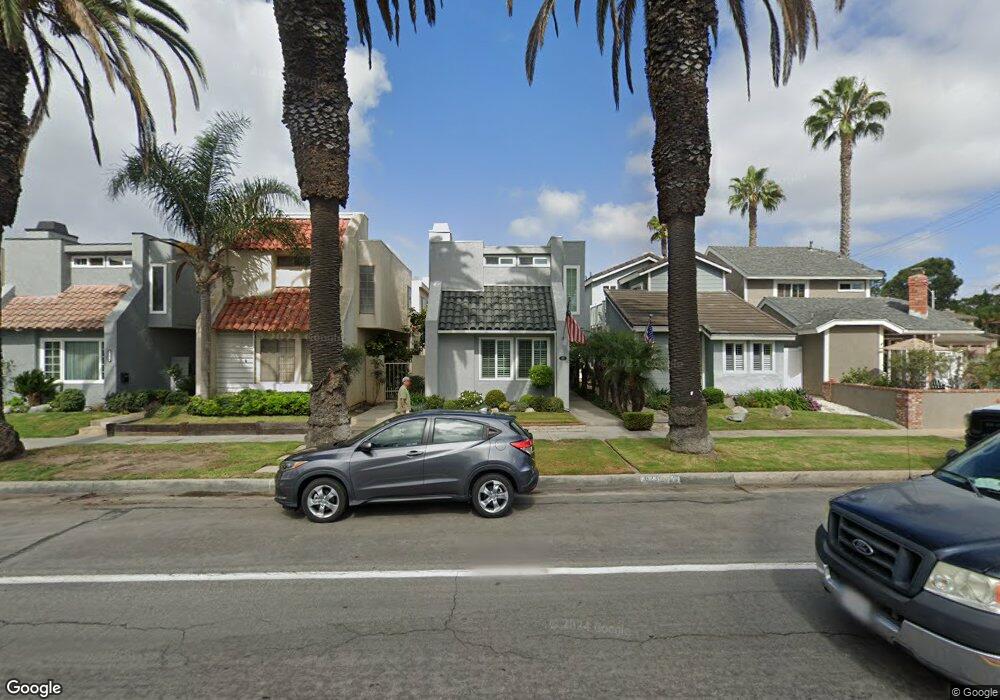
This home is located at 623 17th St, Huntington Beach, CA 92648 and is currently estimated at $1,751,251, approximately $860 per square foot. 623 17th St is a home located in Orange County with nearby schools including Agnes L. Smith Elementary, Ethel Dwyer Middle, and Huntington Beach High School.
Ownership History
Date
Name
Owned For
Owner Type
Purchase Details
Closed on
Apr 1, 2014
Sold by
Dabusco John and Dabusco Karen
Bought by
Dabusco Living Trust
Current Estimated Value
Purchase Details
Closed on
Jul 3, 2001
Sold by
Campbell Colin K and Campbell Lynne I
Bought by
Dabusco John and Dabusco Karen
Home Financials for this Owner
Home Financials are based on the most recent Mortgage that was taken out on this home.
Original Mortgage
$410,300
Outstanding Balance
$158,693
Interest Rate
7.19%
Estimated Equity
$1,592,558
Create a Home Valuation Report for This Property
The Home Valuation Report is an in-depth analysis detailing your home's value as well as a comparison with similar homes in the area
Home Values in the Area
Average Home Value in this Area
Purchase History
| Date | Buyer | Sale Price | Title Company |
|---|---|---|---|
| Dabusco Living Trust | -- | None Available | |
| Dabusco John | $513,000 | Commonwealth Land Title |
Source: Public Records
Mortgage History
| Date | Status | Borrower | Loan Amount |
|---|---|---|---|
| Open | Dabusco John | $410,300 |
Source: Public Records
Tax History Compared to Growth
Tax History
| Year | Tax Paid | Tax Assessment Tax Assessment Total Assessment is a certain percentage of the fair market value that is determined by local assessors to be the total taxable value of land and additions on the property. | Land | Improvement |
|---|---|---|---|---|
| 2025 | $8,505 | $757,701 | $550,378 | $207,323 |
| 2024 | $8,505 | $742,845 | $539,587 | $203,258 |
| 2023 | $8,314 | $728,280 | $529,007 | $199,273 |
| 2022 | $8,095 | $714,000 | $518,634 | $195,366 |
| 2021 | $7,943 | $700,000 | $508,464 | $191,536 |
| 2020 | $7,891 | $692,823 | $503,250 | $189,573 |
| 2019 | $7,796 | $679,239 | $493,383 | $185,856 |
| 2018 | $7,675 | $665,921 | $483,709 | $182,212 |
| 2017 | $7,572 | $652,864 | $474,224 | $178,640 |
| 2016 | $7,235 | $640,063 | $464,925 | $175,138 |
| 2015 | $7,165 | $630,449 | $457,941 | $172,508 |
| 2014 | $7,014 | $618,100 | $448,971 | $169,129 |
Source: Public Records
Map
Nearby Homes