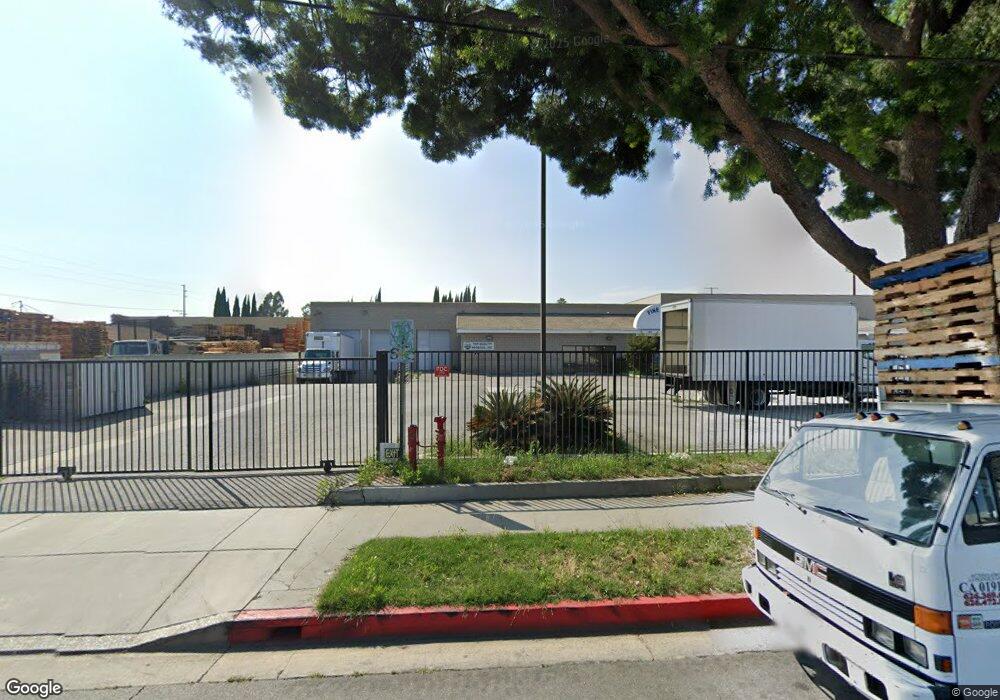
623 Vineland Ave La Puente, CA 91746
West Puente Valley Neighborhood
2
Beds
1
Bath
13,125
Sq Ft
0.6
Acres
About This Home
This home is located at 623 Vineland Ave, La Puente, CA 91746. 623 Vineland Ave is a home located in Los Angeles County with nearby schools including J.E. Van Wig Elementary School, Torch Middle School, and Bassett Senior High School.
Ownership History
Date
Name
Owned For
Owner Type
Purchase Details
Closed on
Aug 14, 2017
Sold by
Cheng Thomas
Bought by
Vineland Max Llc
Home Financials for this Owner
Home Financials are based on the most recent Mortgage that was taken out on this home.
Original Mortgage
$3,400,000
Outstanding Balance
$2,842,378
Interest Rate
4.03%
Mortgage Type
Commercial
Purchase Details
Closed on
Jun 15, 2004
Sold by
Cheng Judy Tzu Chun
Bought by
Cheng Thomas
Home Financials for this Owner
Home Financials are based on the most recent Mortgage that was taken out on this home.
Original Mortgage
$750,000
Interest Rate
5.86%
Mortgage Type
Commercial
Purchase Details
Closed on
May 19, 2004
Sold by
Nshe Paducah Llc
Bought by
Cheng Thomas
Home Financials for this Owner
Home Financials are based on the most recent Mortgage that was taken out on this home.
Original Mortgage
$750,000
Interest Rate
5.86%
Mortgage Type
Commercial
Create a Home Valuation Report for This Property
The Home Valuation Report is an in-depth analysis detailing your home's value as well as a comparison with similar homes in the area
Home Values in the Area
Average Home Value in this Area
Purchase History
| Date | Buyer | Sale Price | Title Company |
|---|---|---|---|
| Vineland Max Llc | $4,186,000 | Chicago Title Company | |
| Cheng Thomas | -- | Fidelity National Title | |
| Cheng Thomas | $2,545,500 | Fidelity National Title | |
| Nhse Paducah Llc | -- | Fidelity National Title |
Source: Public Records
Mortgage History
| Date | Status | Borrower | Loan Amount |
|---|---|---|---|
| Open | Vineland Max Llc | $3,400,000 | |
| Previous Owner | Nhse Paducah Llc | $750,000 | |
| Previous Owner | Cheng Thomas | $1,145,000 | |
| Closed | Cheng Thomas | $1,145,000 |
Source: Public Records
Tax History Compared to Growth
Tax History
| Year | Tax Paid | Tax Assessment Tax Assessment Total Assessment is a certain percentage of the fair market value that is determined by local assessors to be the total taxable value of land and additions on the property. | Land | Improvement |
|---|---|---|---|---|
| 2025 | $30,811 | $2,275,653 | $1,194,718 | $1,080,935 |
| 2024 | $30,811 | $2,231,034 | $1,171,293 | $1,059,741 |
| 2023 | $29,920 | $2,187,289 | $1,148,327 | $1,038,962 |
| 2022 | $28,658 | $2,144,402 | $1,125,811 | $1,018,591 |
| 2021 | $28,115 | $2,102,356 | $1,103,737 | $998,619 |
| 2020 | $27,971 | $2,080,800 | $1,092,420 | $988,380 |
| 2019 | $27,425 | $2,040,000 | $1,071,000 | $969,000 |
| 2018 | $26,251 | $2,000,000 | $1,050,000 | $950,000 |
| 2016 | $19,564 | $1,454,789 | $529,869 | $924,920 |
| 2015 | $19,110 | $1,432,937 | $521,910 | $911,027 |
| 2014 | -- | $1,404,869 | $511,687 | $893,182 |
Source: Public Records
Map
Nearby Homes
- 13426 Austen Way
- 720 Le Borgne Ave
- 13622 Hartsville St
- 915 Stichman Ave
- 1003 Le Borgne Ave
- 13540 Valley Blvd
- 13903 Moccasin St
- 610 Willow Ave
- 335 Willow Ave
- 452 Willow Ave
- 765 Frazier St
- 208 S 2nd Ave
- 12828 Hensel St
- 12822 Hensel St
- 979 Willow Ave Unit 31
- 943 Willow Ave
- 234 S Covina Blvd
- 13120 Dart St Unit E
- 433 Sunkist Ave
- 12944 Bess Ave
- 637 Vineland Ave
- 617 Vineland Ave
- 13387 Temple Ave
- 628 Vineland Ave
- 622 Vineland Ave
- 632 Vineland Ave
- 606 Vineland Ave
- 616 Vineland Ave
- 638 Vineland Ave
- 646 Vineland Ave
- 13409 Temple Ave
- 652 Vineland Ave
- 13415 Temple Ave
- 658 Vineland Ave
- 13428 Lassalette St
- 13431 Lassalette St
- 13347 Temple Ave
- 13401 Browning Place Unit 1
- 13401 Browning Place
- 13421 Temple Ave