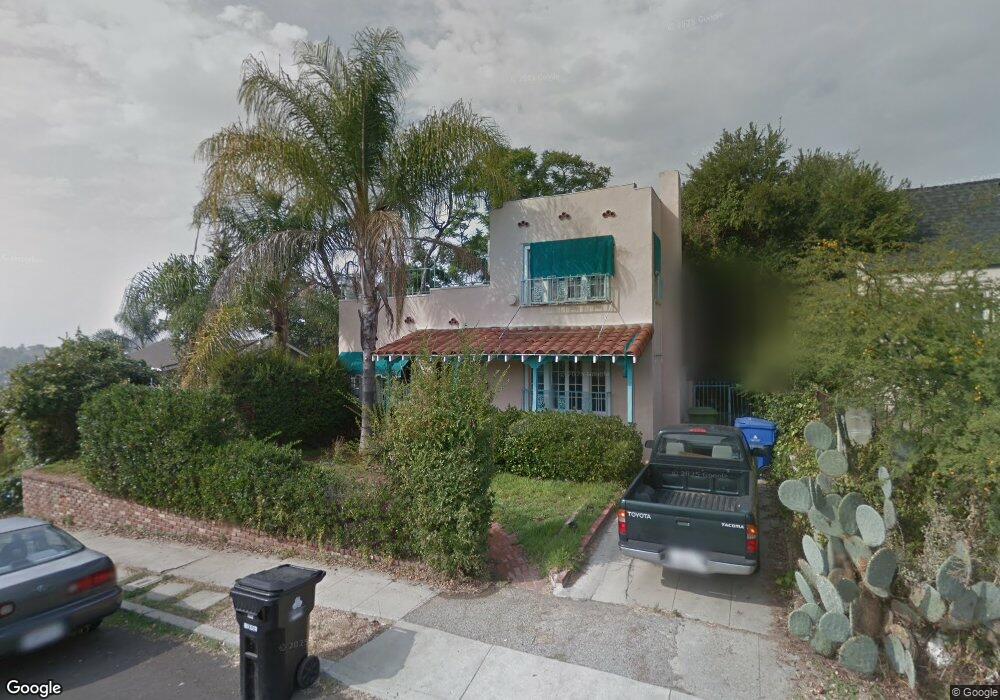
6233 Saylin Ln Los Angeles, CA 90042
Estimated Value: $1,149,083 - $1,336,000
3
Beds
2
Baths
1,461
Sq Ft
$856/Sq Ft
Est. Value
About This Home
This home is located at 6233 Saylin Ln, Los Angeles, CA 90042 and is currently estimated at $1,251,271, approximately $856 per square foot. 6233 Saylin Ln is a home located in Los Angeles County with nearby schools including Annandale Elementary, Garvanza Elementary, and Luther Burbank Middle School.
Ownership History
Date
Name
Owned For
Owner Type
Purchase Details
Closed on
Aug 7, 2014
Sold by
Aulenta Ralph A
Bought by
Aulenta Ralph A and Marchbanks Janet E
Current Estimated Value
Home Financials for this Owner
Home Financials are based on the most recent Mortgage that was taken out on this home.
Original Mortgage
$315,000
Outstanding Balance
$240,187
Interest Rate
4.11%
Mortgage Type
New Conventional
Estimated Equity
$1,011,084
Purchase Details
Closed on
Jul 10, 2000
Sold by
Norris Donald G
Bought by
Aulenta Ralph and Aulenta Janet Marchbanks
Home Financials for this Owner
Home Financials are based on the most recent Mortgage that was taken out on this home.
Original Mortgage
$204,000
Interest Rate
8.19%
Purchase Details
Closed on
Dec 11, 1996
Sold by
Horrocks Devan
Bought by
Norris Donald G
Home Financials for this Owner
Home Financials are based on the most recent Mortgage that was taken out on this home.
Original Mortgage
$166,000
Interest Rate
7.74%
Create a Home Valuation Report for This Property
The Home Valuation Report is an in-depth analysis detailing your home's value as well as a comparison with similar homes in the area
Home Values in the Area
Average Home Value in this Area
Purchase History
| Date | Buyer | Sale Price | Title Company |
|---|---|---|---|
| Aulenta Ralph A | -- | Western Resources Title Co | |
| Aulenta Ralph | $255,000 | Commonwealth Land Title Co | |
| Norris Donald G | $184,500 | Commonwealth Land Title Co |
Source: Public Records
Mortgage History
| Date | Status | Borrower | Loan Amount |
|---|---|---|---|
| Open | Aulenta Ralph A | $315,000 | |
| Closed | Aulenta Ralph | $204,000 | |
| Previous Owner | Norris Donald G | $166,000 |
Source: Public Records
Tax History Compared to Growth
Tax History
| Year | Tax Paid | Tax Assessment Tax Assessment Total Assessment is a certain percentage of the fair market value that is determined by local assessors to be the total taxable value of land and additions on the property. | Land | Improvement |
|---|---|---|---|---|
| 2025 | $4,639 | $384,222 | $188,344 | $195,878 |
| 2024 | $4,639 | $376,689 | $184,651 | $192,038 |
| 2023 | $4,549 | $369,304 | $181,031 | $188,273 |
| 2022 | $4,336 | $362,064 | $177,482 | $184,582 |
| 2021 | $4,276 | $354,965 | $174,002 | $180,963 |
| 2019 | $4,146 | $344,439 | $168,842 | $175,597 |
| 2018 | $4,121 | $337,686 | $165,532 | $172,154 |
| 2016 | $3,925 | $324,575 | $159,105 | $165,470 |
| 2015 | $3,868 | $319,701 | $156,716 | $162,985 |
| 2014 | $3,886 | $313,440 | $153,647 | $159,793 |
Source: Public Records
Map
Nearby Homes
- 6218 Saylin Ln
- 355 Kirby St
- 328 Vista Place
- 6225 Beard St
- 1124 Highgrove Terrace
- 1465 Washburn Rd
- 935 N Staley Ln
- 560 Neva Place
- 576 Neva Place
- 310 Branch St
- 234 Newland St
- 6150 Strickland Ave
- 426 N Avenue 64
- 549 Meridian Terrace
- 6134 Strickland Ave
- 6849 N Figueroa St
- 0 N Avenue 62
- 6050 Burwood Ave
- 6048 Burwood Ave
- 6565 Pickwick St